Decode Network Logs: Capture, Analyze & Share Easily
Your lightweight Client for API debugging
No Login Required
Requestly isn’t available for download on mobile or tablets.
To download it, please open this page on a desktop PC and enter your email to get the link.



- Local Projects
- Organize API into Collections & Environments
- API Tests
- Import from Postman, OpenAPI, etc


- Redirect URLs & modify HTTP headers
- Mock API / GraphQL responses
- Insert custom JavaScript scripts
Network logs serve as a vital tool for web developers , providing valuable insights into the communication between web applications and servers. By examining the network logs, developers can understand how data is transferred, identify performance bottlenecks, and debug issues effectively.
What Information is Contained in Network Logs
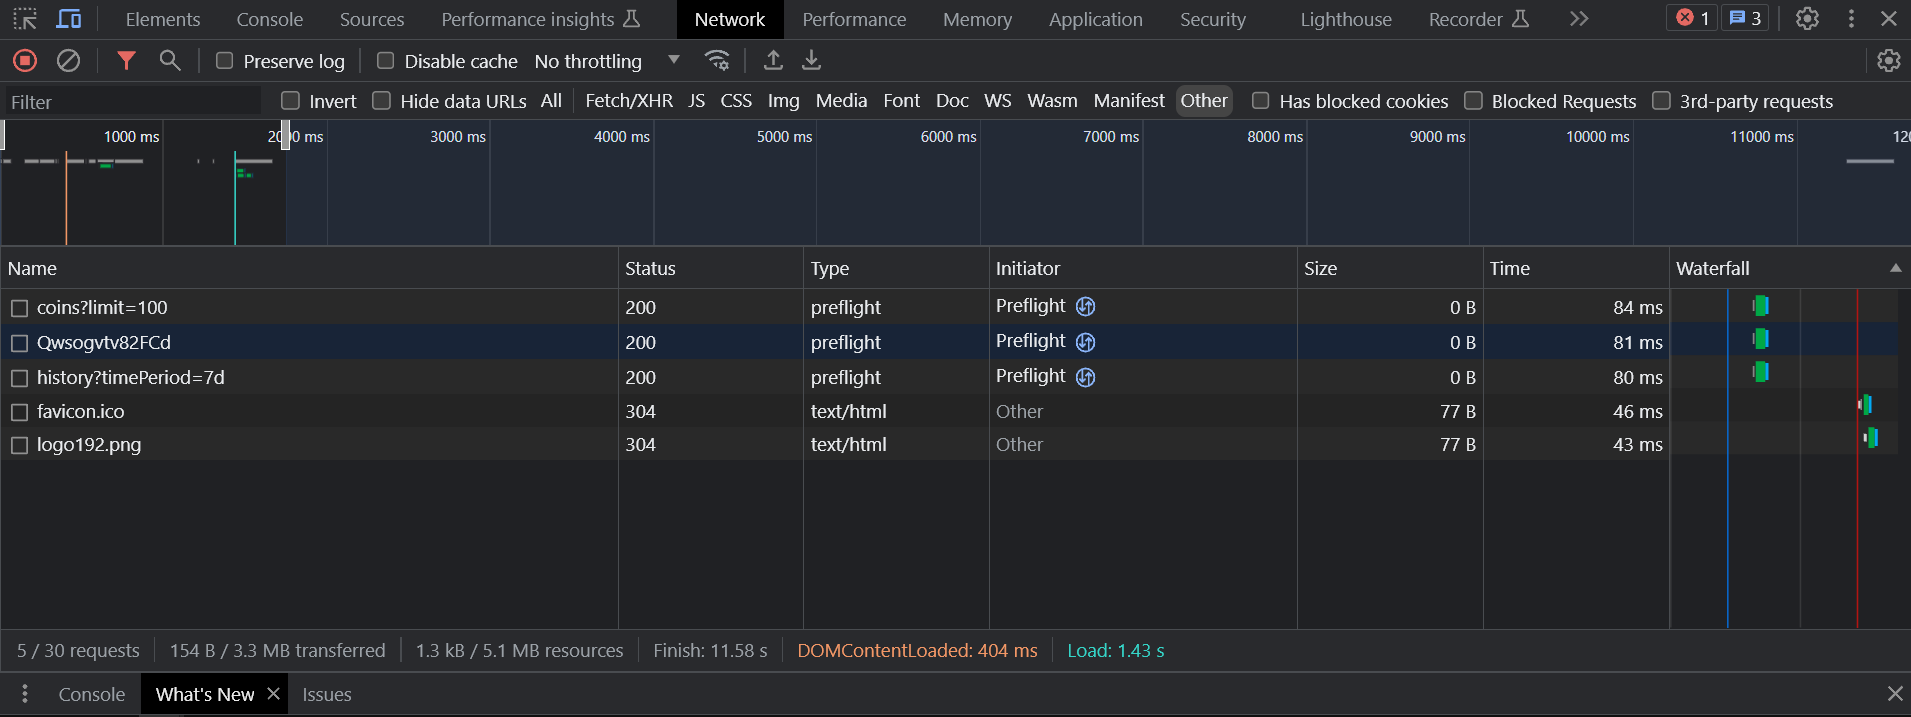
Network logs contain a wealth of information that sheds light on the interactions between the client (usually a web browser) and the server. Here are the key components typically found in network logs:
Request and Response Headers
Request headers include important metadata sent by the client to the server. This information can encompass the user agent, content type, authentication credentials, and cookies, among other details. On the other hand, response headers come from the server and include data like cache control directives, server type, and response content type.
Request and Response Bodies
The request body holds data sent by the client to the server, such as form submissions, JSON payloads, or file uploads. Similarly, the response body contains the data returned by the server, which may include HTML content, JSON responses, or binary data like images or videos.
Status Codes
Status codes indicate the success or failure of a network request. They provide a quick way to understand whether a request was processed successfully or if an error occurred. Common status codes include 200 (OK), 404 (Not Found), and 500 (Internal Server Error).
Timings
Timings in network logs reveal the time taken for various stages of the request-response cycle. This includes the time it took to establish a connection, send the request, receive the response, and any additional processing time.
Initiator
The initiator denotes the cause or trigger behind a particular network request. It can be a user action, such as clicking a link or submitting a form, or it might be initiated by JavaScript code, AJAX calls, or other resources loaded on the web page.
Let’s take a look at a screenshot from the Chrome DevTools Network tab, which showcases the information contained in network logs:
Network logs encompass various types of interactions between the client and the server. Understanding these different types is essential for diagnosing specific issues and improving the overall performance of web applications. Here are some common types of network logs:
API Calls
API calls involve requests made to external Application Programming Interfaces (APIs). These requests are used to retrieve or send data from and to third-party services or the application’s backend.
Scripts
Network logs can also capture information related to JavaScript or other client-side code execution. This includes fetching JavaScript files, CSS stylesheets, and other resources necessary to render the web page.
WebSockets
WebSockets enable real-time bidirectional communication between the client and the server. They facilitate the exchange of data without the need to send repeated requests, making them ideal for applications that require constant updates or live data streams.
By understanding the different types of network logs, developers can gain valuable insights into how their web applications communicate with external resources and optimize their performance accordingly.
Capturing Network Logs
Capturing network logs is a crucial step in diagnosing and resolving issues related to web applications. Let’s explore two methods to capture network logs effectively:
Download as HAR
One of the common ways to capture network logs is by using the HAR (HTTP Archive) file format. Modern web browsers, such as Chrome, Firefox, and Edge, offer built-in developer tools that allow you to download network logs as HAR files. Here’s how you can do it in Chrome:
- Open the webpage you want to capture network logs for.
- Right-click on the page and select “Inspect” or press Ctrl + Shift + I (or Cmd + Option + I on macOS) to open Chrome DevTools.
- In Chrome DevTools, navigate to the “Network” tab.
- Refresh the page (F5 or Ctrl + R / Cmd + R).
- Once the network activity is captured, right-click anywhere in the Network tab and select “Save as HAR with Content” to download the HAR file.
Limitations of Downloading as HAR
While HAR files are helpful for capturing a snapshot of network activity, they come with certain limitations:
- Incomplete Picture: HAR files may not provide a complete picture of what happened during user interactions or debugging sessions. For example, they might not capture errors reported in the browser’s console or errors thrown to the end user.
- Lack of Context: When troubleshooting issues, it’s essential to know which specific user activity triggered a particular network request. HAR files often lack this context, making it challenging to pinpoint the root cause of the problem.
Using Requestly Sessions
To overcome the limitations of HAR files and capture more detailed network logs, you can use Requestly Sessions—a powerful tool designed explicitly for this purpose. Requestly Session provides real-time monitoring of network traffic during user interactions, making it an excellent choice for debugging and analysis.
How to Use Requestly Sessions
- Install the Requestly browser extension for Chrome or Firefox (if you haven’t already).
- Open the webpage you want to capture network logs for.
- Click on the Requestly extension icon, and a panel will appear.
- Start recording a session by clicking the “Start Session” button in the panel.
- Perform the desired user interactions, navigate through the application, and trigger network requests.
- Stop the recording by clicking the “Stop Session” button.
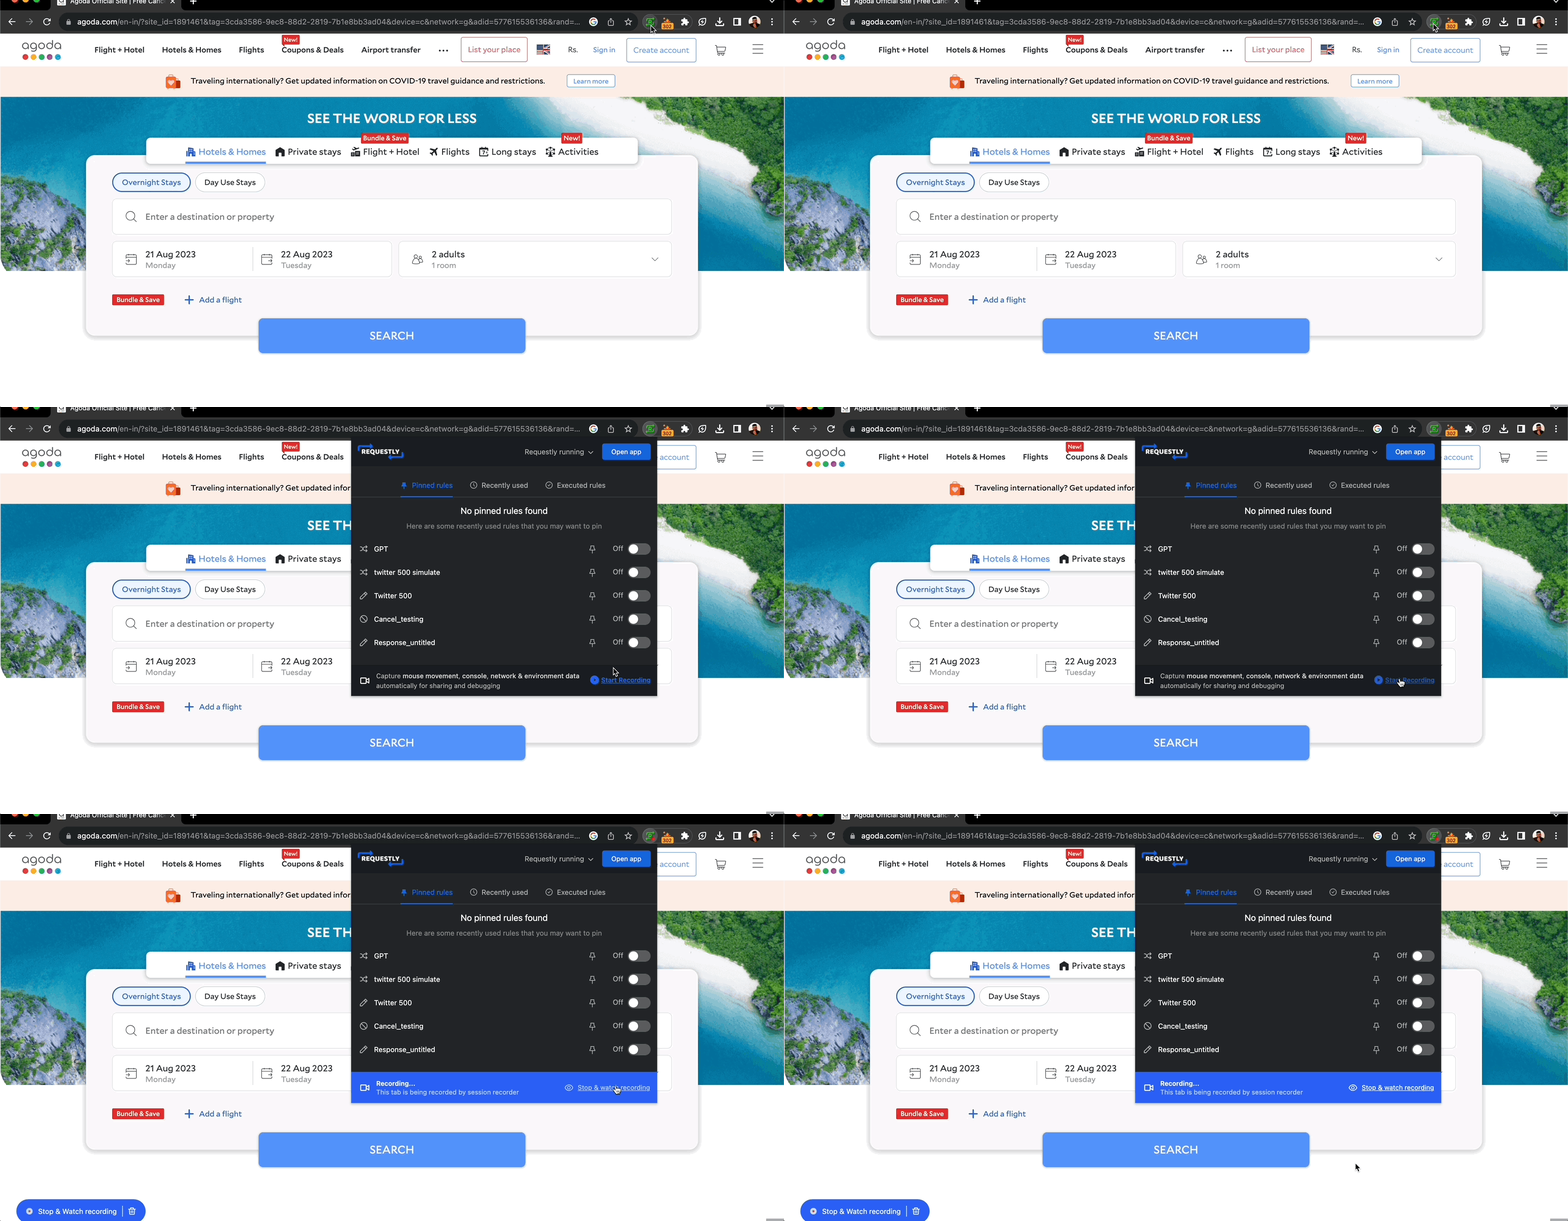
Requestly Session offers a more comprehensive view of network activity, providing detailed insights into user interactions and the corresponding network requests. This allows developers to understand the complete context and helps in more efficient debugging.When you open a captured session, you get a comprehensive view of:
- Timeline Replay of User Activity: Requestly visually replays user interactions along with the corresponding network traffic timeline. This makes it easier to grasp the sequence of requests and responses, helping you identify potential issues and patterns.
- Granular Insights: By inspecting individual network requests and responses, you can gain granular insights into the data exchanged between the client and server. This level of detail enhances your understanding of how your web application communicates with external resources.
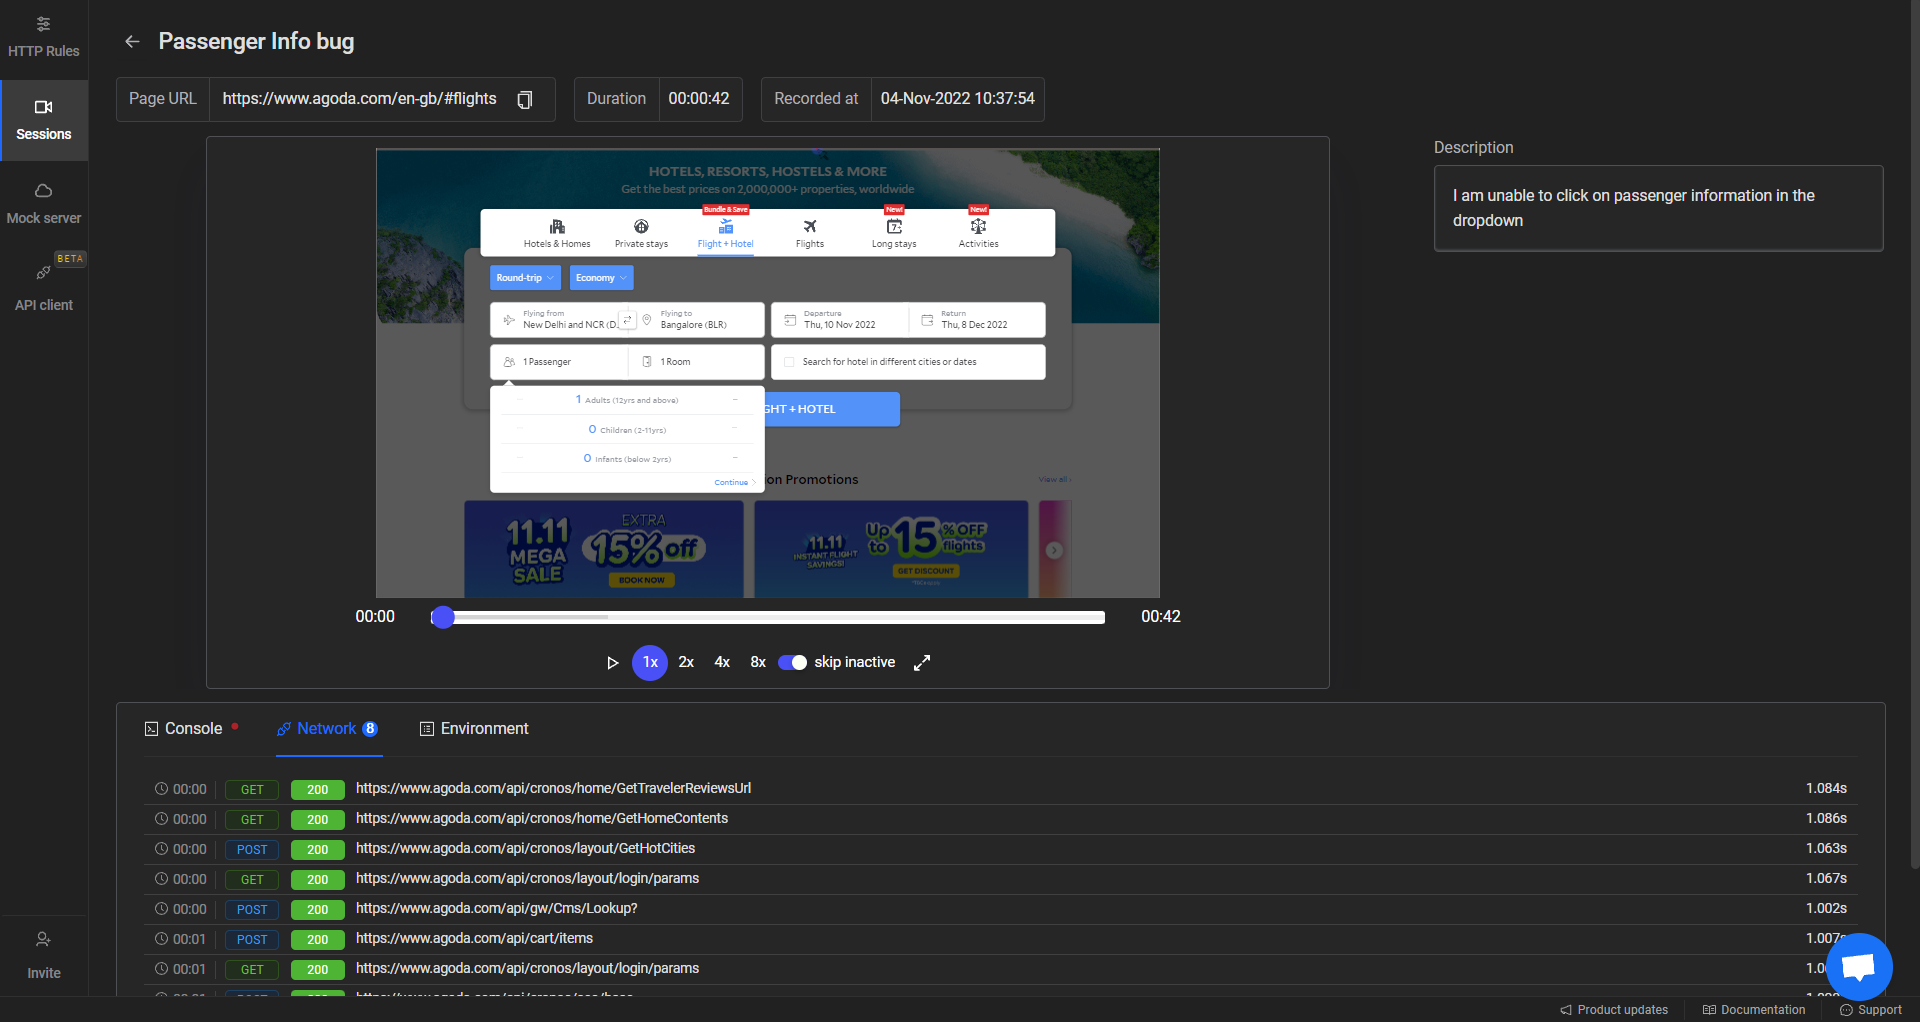
By utilizing Requestly Session, you can take your network log capture process to the next level, enabling faster and more accurate issue identification and resolution.
How to Share Network Logs
After capturing valuable network logs using Requestly Sessions, you’ll likely want to share this critical information with your team members or stakeholders for collaborative analysis and debugging. Here are two convenient methods to share network logs captured through Requestly Sessions:
Generate Link of Requestly Session
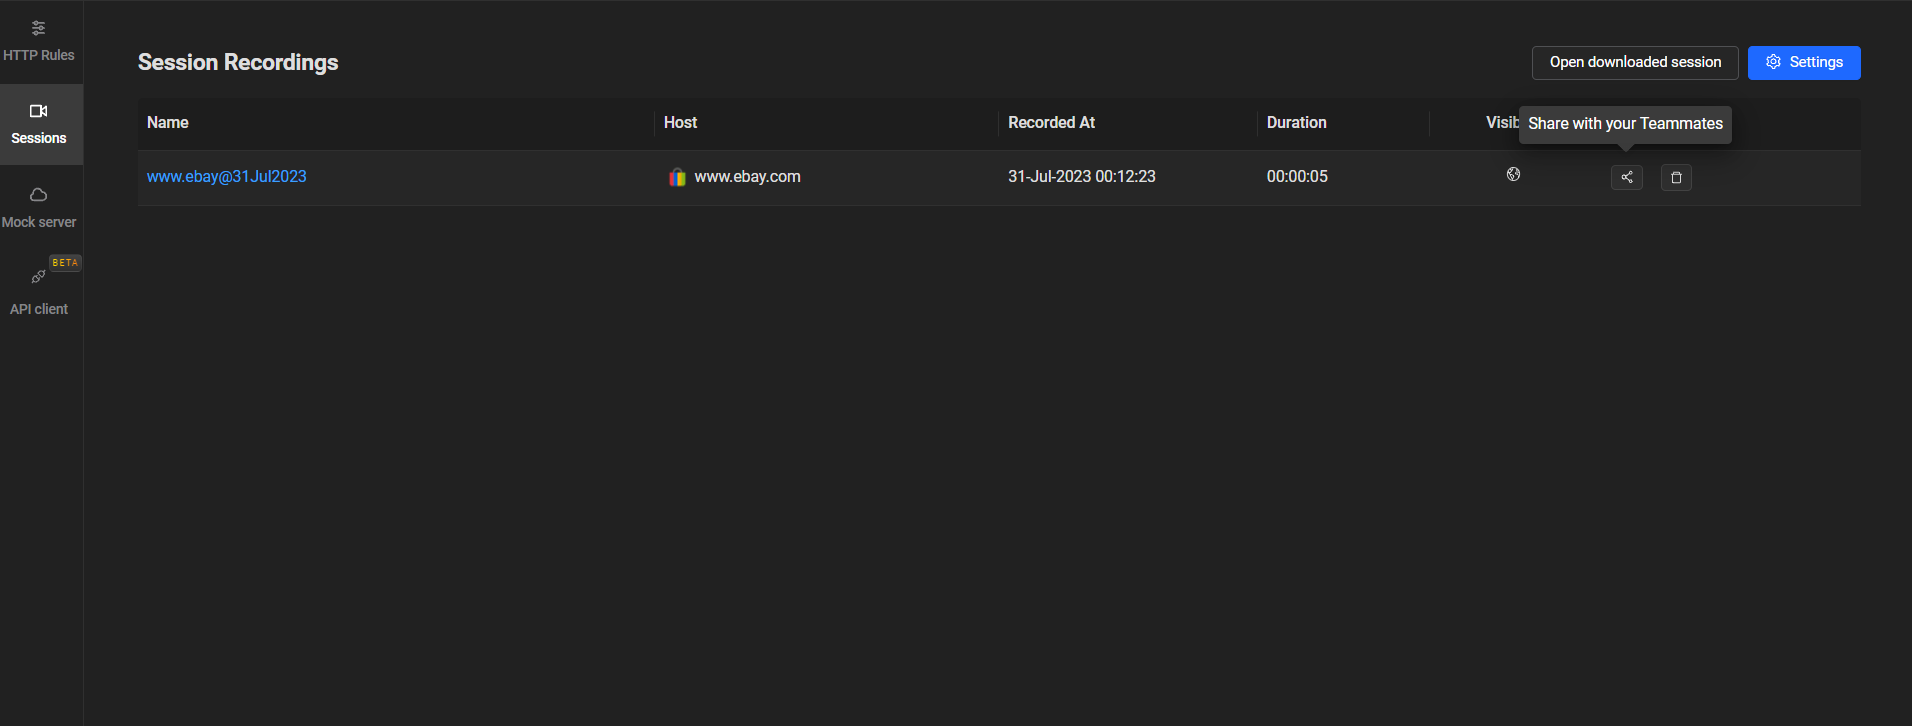
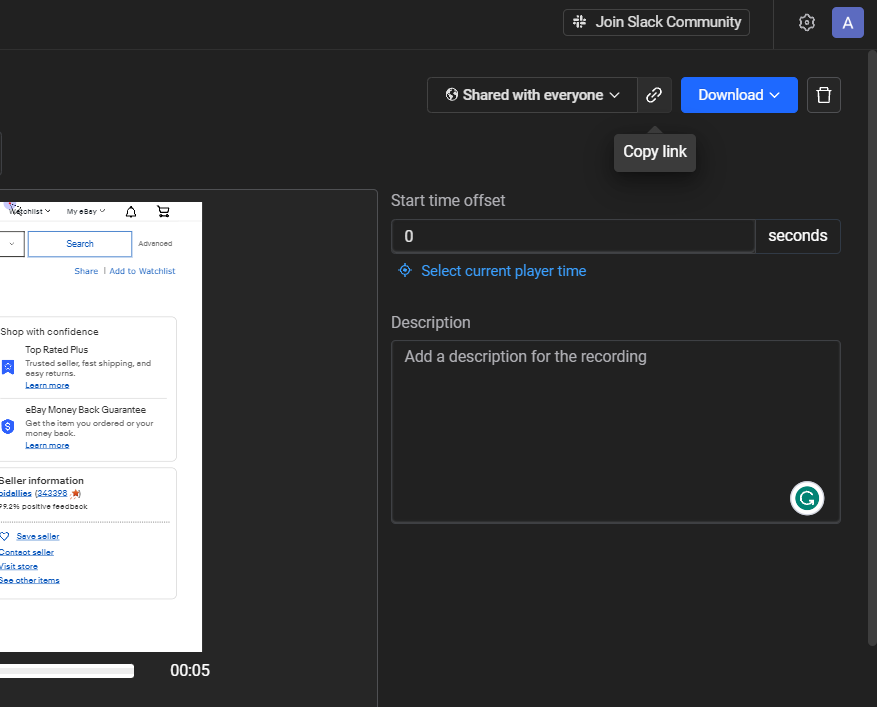
Requestly Sessions makes sharing network logs effortless by providing a simple way to generate a shareable link. This link allows others to access and view the captured network logs directly in their web browser without the need for any additional setup.
How to Generate a Shareable Link
- After recording a Requestly Session (as explained in the previous section), open the Requestly extension panel.
- Locate the recorded session you want to share in the “Sessions” tab.
- Click on the “Share” icon or right-click on the session and select “Generate Shareable Link.”
- Requestly will generate a unique URL for the session, which you can copy and share with your colleagues.
Benefits of Using Shareable Links
- Instant Access: Shareable links provide instant access to the captured network logs, eliminating the need for cumbersome file transfers or attachments.
- Real-Time Updates: Anyone with access to the link can view the network logs in real-time, even if you continue capturing data. This real-time collaboration facilitates faster troubleshooting and issue resolution.
Download Local File
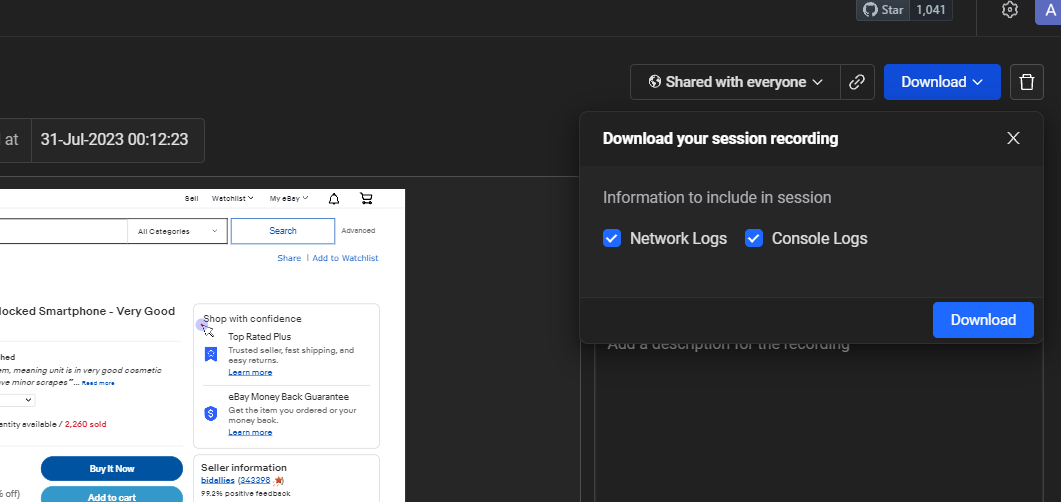
Another option for sharing network logs is to download the captured Requestly Session as a local file. This method is useful when you need to share the logs through alternative communication channels, such as email or shared cloud storage. To download a Local File
- Once you’ve recorded and stopped the Requestly Session (as explained earlier), open the Requestly extension panel.
- Locate the recorded session you want to download in the “Sessions” tab.
- Click on the “Download” icon or right-click on the session and select “Download.”
- Requestly will save the session data as a file with the “.requestly” extension.
Advantages of Downloading Local Files
- Flexibility: Downloaded local files can be shared using various file-sharing methods, making it convenient to distribute the network logs through channels of your choice.
- Offline Access: Recipients can access and import the downloaded Requestly Session into their own Requestly tool for analysis, even without a live internet connection.
By leveraging the two sharing methods offered by Requestly Sessions—generate shareable links and download local files—you can easily collaborate with your team and stakeholders, enabling a more efficient and comprehensive analysis of captured network logs. This streamlined sharing process enhances the overall debugging workflow, leading to quicker issue identification and resolution.
How to Analyze Network Logs
After successfully capturing network logs using Requestly Sessions, the next step is to analyze the data to identify issues, optimize performance, and gain valuable insights into your web application’s behavior. Let’s explore two effective methods to analyze network logs captured through Requestly Sessions:
Using Requestly Session
Requestly Sessions provide a powerful and user-friendly interface to analyze network logs. By opening a recorded session, you can visually inspect network traffic, replay user activity along the timeline, and delve into the details of individual network requests and responses.
- Open the Requestly extension panel in your web browser.
- Navigate to the “Sessions” tab and locate the recorded session you want to analyze.
- Click on the session to open it.
- Requestly will display the recorded user interactions and the corresponding network traffic timeline.
Benefits of Analyzing with Requestly Session
- Timeline Replay: By replaying the user activity timeline, you can visualize the sequence of network requests and responses, providing a comprehensive understanding of how the application behaves during specific user interactions.
- Network Details: Clicking on individual network requests reveals detailed information such as request headers, response headers, request and response bodies, and timing data. This level of granularity aids in identifying potential performance bottlenecks and errors.
How to Use Requestly API Client
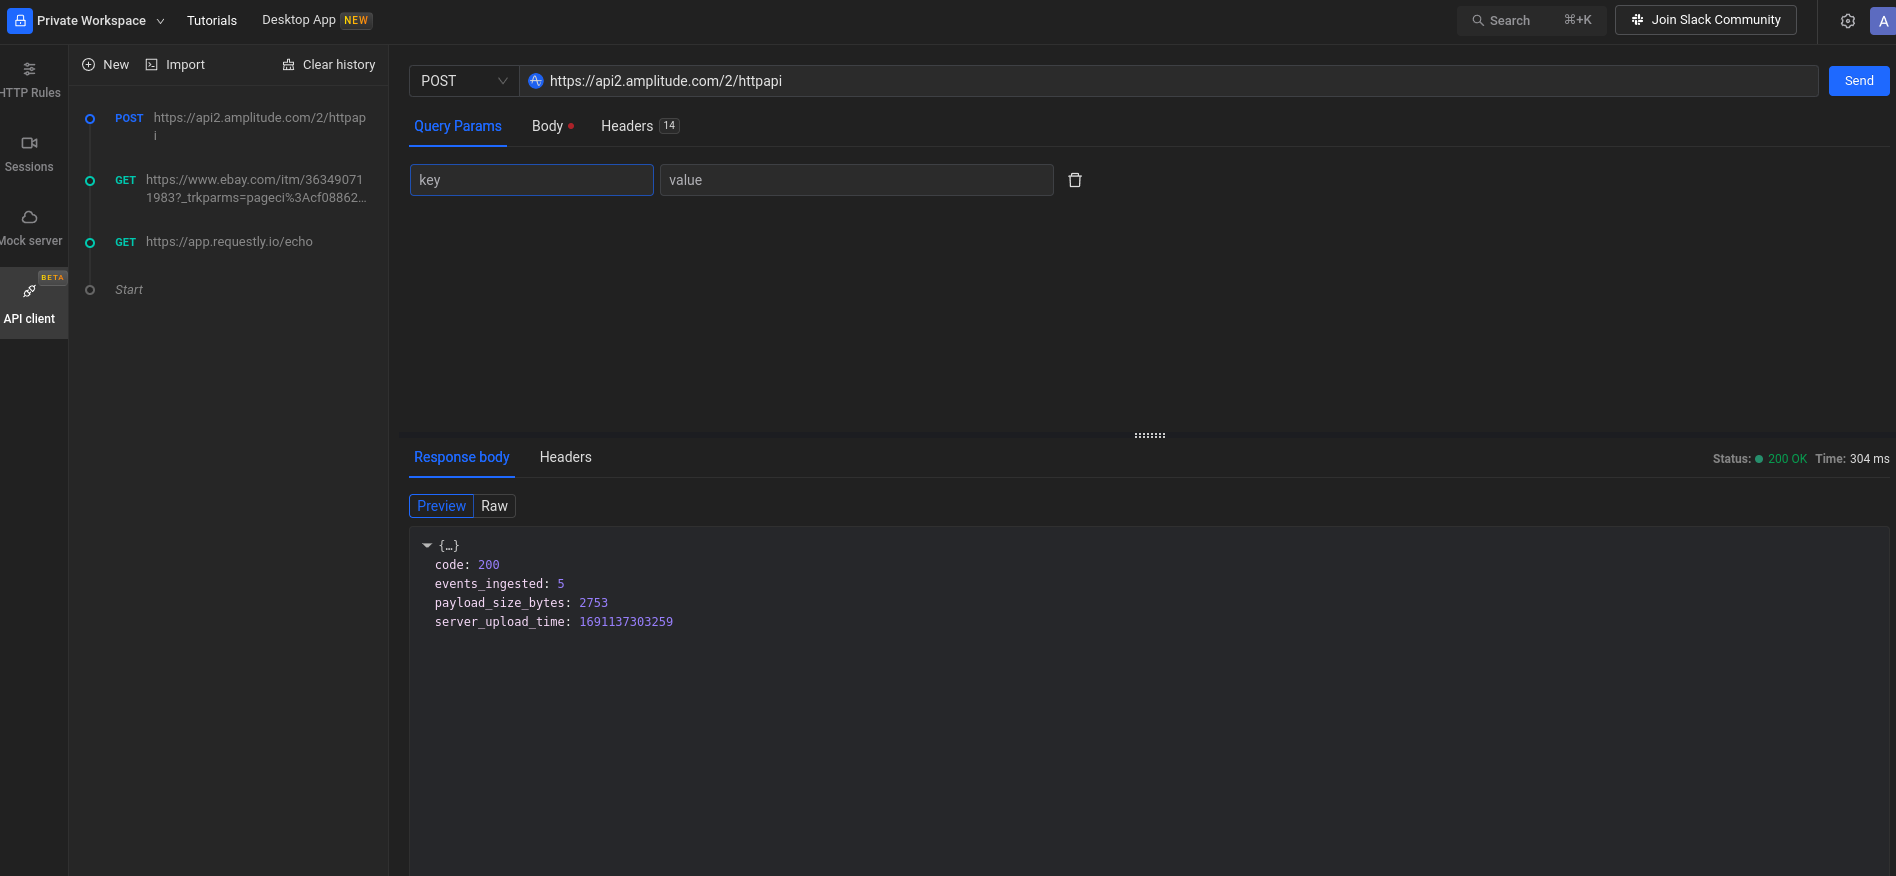
To conduct more in-depth analysis and debugging, you can copy cURL commands from Requestly Sessions and use the Requestly API Client in a new tab. This allows you to directly inspect the latest responses and gain additional insights into the network interactions.
- Select a network request that you want to inspect further.
- Open a new browser tab and visit the Requestly API Client (available within the Requestly extension).
- In the API Client, click on import and paste the cURL, and click “Send.”
- The API Client will display the latest response data received for the chosen request.
Advantages of Using Requestly API Client
- Deeper Inspection: The Requestly API Client allows you to inspect the latest responses in real-time, enabling a detailed analysis of server responses and ensuring that data is being exchanged correctly.
- Advanced Debugging: With the API Client, you can perform advanced debugging operations and evaluate the precise data received from the server. This is especially useful when dealing with complex APIs or troubleshooting specific issues.
By combining the visual analysis provided by Requestly Sessions with the advanced debugging capabilities of the Requestly API Client, you can conduct a thorough analysis of network logs, leading to quicker issue resolution and optimized web application performance.
Conclusion
In conclusion, network logs play a crucial role in optimizing web application performance and identifying potential issues. They contain information about the communication between web applications and servers, including request and response headers and bodies, status codes, timings, and initiators. By knowing how to effectively capture and analyze the network logs, developers can speed up their networking process.
Contents
- What Information is Contained in Network Logs
- Capturing Network Logs
- How to Share Network Logs
- Generate Link of Requestly Session
- How to Analyze Network Logs
- Conclusion
- Using Requestly Sessions
- Request and Response Headers
- Request and Response Bodies
- Status Codes
- Timings
- Initiator
- API Calls
- Scripts
- WebSockets
- Download as HAR
- Limitations of Downloading as HAR
- How to Use Requestly Sessions
- How to Generate a Shareable Link
- Benefits of Using Shareable Links
- Download Local File
- Advantages of Downloading Local Files
- Using Requestly Session
- Benefits of Analyzing with Requestly Session
- How to Use Requestly API Client
- Advantages of Using Requestly API Client
Subscribe for latest updates
Share this article
Related posts
Get started today
Requestly isn’t available for download on mobile or tablets.
To download it, please open this page on a desktop PC and enter your email to get the link.


- Local Projects
- Organize API into Collections & Environments
- API Tests
- Import from Postman, OpenAPI, etc


- Redirect URLs & modify HTTP headers
- Mock API / GraphQL responses
- Insert custom JavaScript scripts


