How to Download all Network Requests of a Website

Your lightweight Client for API debugging
No Login Required
Requestly isn’t available for download on mobile or tablets.
To download it, please open this page on a desktop PC and enter your email to get the link.


- Local Projects
- Organize API into Collections & Environments
- API Tests
- Import from Postman, OpenAPI, etc


- Redirect URLs & modify HTTP headers
- Mock API / GraphQL responses
- Insert custom JavaScript scripts
Network logs serve as a vital tool for web developers , providing valuable insights into the communication between web applications and servers. By examining the network logs, developers can understand how data is transferred, identify performance bottlenecks, and debug issues effectively.
Network logs are like detailed records of conversations between a person’s computer (usually their web browser) and a remote computer (called a server). These logs hold a lot of valuable information that helps us understand how they talk to each other.
Capturing Network Logs
Getting network logs is really important for figuring out and fixing issues with web applications. So, let’s look at two ways to get these logs effectively :
Download as HAR
One of the common ways to capture network logs is by using the HAR (HTTP Archive) file format. Modern web browsers, such as Chrome, Firefox, and Edge, offer built-in developer tools that allow you to download network logs as HAR files. Here’s how you can do it in Chrome:
- Open the webpage you want to capture network logs for.
- Right-click on the page and select “Inspect” or press Ctrl + Shift + I (or Cmd + Option + I on macOS) to open Chrome DevTools.
- In Chrome DevTools, navigate to the “Network” tab.
- Refresh the page (F5 or Ctrl + R / Cmd + R).
- Once the network activity is captured, right-click anywhere in the Network tab and select “Save as HAR with Content” to download the HAR file.
Drawbacks of HAR File Downloads
While HAR files are useful for recording network activity snapshots, they do have some limitations:
- Incomplete Overview: HAR files might not capture everything that occurred during user interactions or debugging sessions. For example, they might miss error messages shown in the browser’s console or errors that the user encountered.
- Contextual Deficiency: When trying to solve problems, it’s important to know which specific user action led to a particular network request. HAR files often lack this context, which makes it harder to figure out the main cause of the problem.
Using Requestly Sessions
Using Requestly Sessions To overcome the limitations of HAR files and capture more detailed network logs, you can use Requestly Sessions—a powerful tool designed explicitly for this purpose. Requestly Session provides real-time monitoring of network traffic during user interactions, making it an excellent choice for debugging and analysis.
How to Use Requestly Sessions
- Install the Requestly browser extension for Chrome or Firefox (if you haven’t already).
- Open the webpage you want to capture network logs for.
- Click on the Requestly extension icon, and a panel will appear.
- Start recording a session by clicking the “Start Session” button in the panel.
- Perform the desired user interactions, navigate through the application, and trigger network requests.
- Stop the recording by clicking the “Stop Session” button
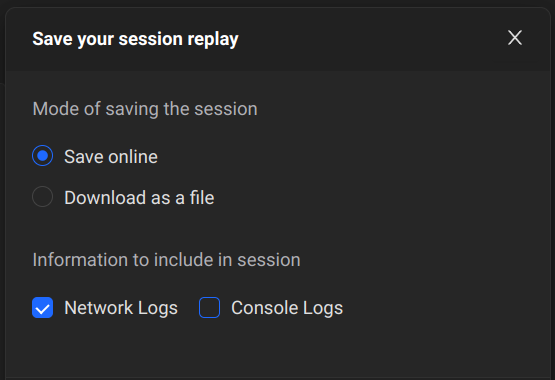
To Share Network Logs there are two convenient methods to share network logs captured through Requestly Sessions:
- Save Online Requestly Sessions makes sharing network logs effortless by providing a simple way to generate a shareable link. This link allows others to access and view the captured network logs directly in their web browser without the need for any additional setup.
- Download as a File Another option for sharing network logs is to download the captured Requestly Session as a local file. This method is useful when you need to share the logs through alternative communication channels, such as email or shared cloud storage

Conclusion
In conclusion, network logs play a crucial role in optimising web application performance and identifying potential issues. They contain information about the communication between web applications and servers, including request and response headers and bodies, status codes, timings, and initiators. By knowing how to effectively capture and analyse the network logs, developers can speed up their networking process.
Contents
Subscribe for latest updates
Share this article
Related posts
Get started today
Requestly isn’t available for download on mobile or tablets.
To download it, please open this page on a desktop PC and enter your email to get the link.


- Local Projects
- Organize API into Collections & Environments
- API Tests
- Import from Postman, OpenAPI, etc


- Redirect URLs & modify HTTP headers
- Mock API / GraphQL responses
- Insert custom JavaScript scripts


