How to download console logs from a website

Your lightweight Client for API debugging
No Login Required
Requestly isn’t available for download on mobile or tablets.
To download it, please open this page on a desktop PC and enter your email to get the link.


- Local Projects
- Organize API into Collections & Environments
- API Tests
- Import from Postman, OpenAPI, etc


- Redirect URLs & modify HTTP headers
- Mock API / GraphQL responses
- Insert custom JavaScript scripts
When it comes to debugging and troubleshooting issues on a website, console logs are an invaluable resource. Console logs provide developers with a window into what’s happening behind the scenes of a web page, capturing errors, warnings, and other important information that can help identify and fix problems. In this guide, we’ll walk you through the steps to download console logs from a website, whether you’re using Chrome, Firefox, or other popular browsers.
Why Are Console Logs Important?
Before we dive into the “how,” let’s briefly discuss the “why.” Console logs are messages that developers can use to track and monitor the behavior of their website’s JavaScript code. They are particularly useful for:
- Debugging: When a web page isn’t behaving as expected, console logs can help developers identify where errors or unexpected behavior is occurring.
- Error Tracking: Console logs often provide error messages and stack traces that pinpoint the exact location of errors in the code.
- Performance Monitoring: Developers can use console logs to analyze the performance of their website by tracking execution times of different functions and processes.
- User Behavior Analysis: Console logs can help developers understand how users are interacting with their website, helping to improve user experience.
Steps to Download Console Logs
Step 1: Open the Developer Console
The first step is to open the developer console in your browser. Different browsers have different ways of accessing it:

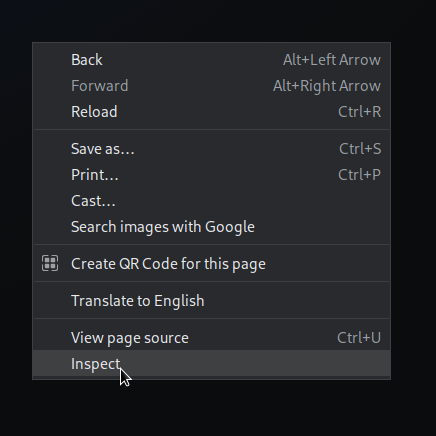
- Google Chrome: Right-click anywhere on the web page and select “Inspect” or “Inspect Element.” Alternatively, you can use the shortcut
Ctrl + Shift + I(orCmd + Option + Ion Mac). - Mozilla Firefox: Similar to Chrome, right-click on the page and select “Inspect Element.” The shortcut
Ctrl + Shift + I(orCmd + Option + Ion Mac) also works. - Microsoft Edge: Right-click on the page and select “Inspect,” or use the shortcut
Ctrl + Shift + I(orCmd + Option + Ion Mac). - Safari: You can enable the Developer menu in Safari’s preferences. Once enabled, you can access the developer console through “Develop” > “Show Web Inspector.”
Step 2: Navigate to the Console Tab
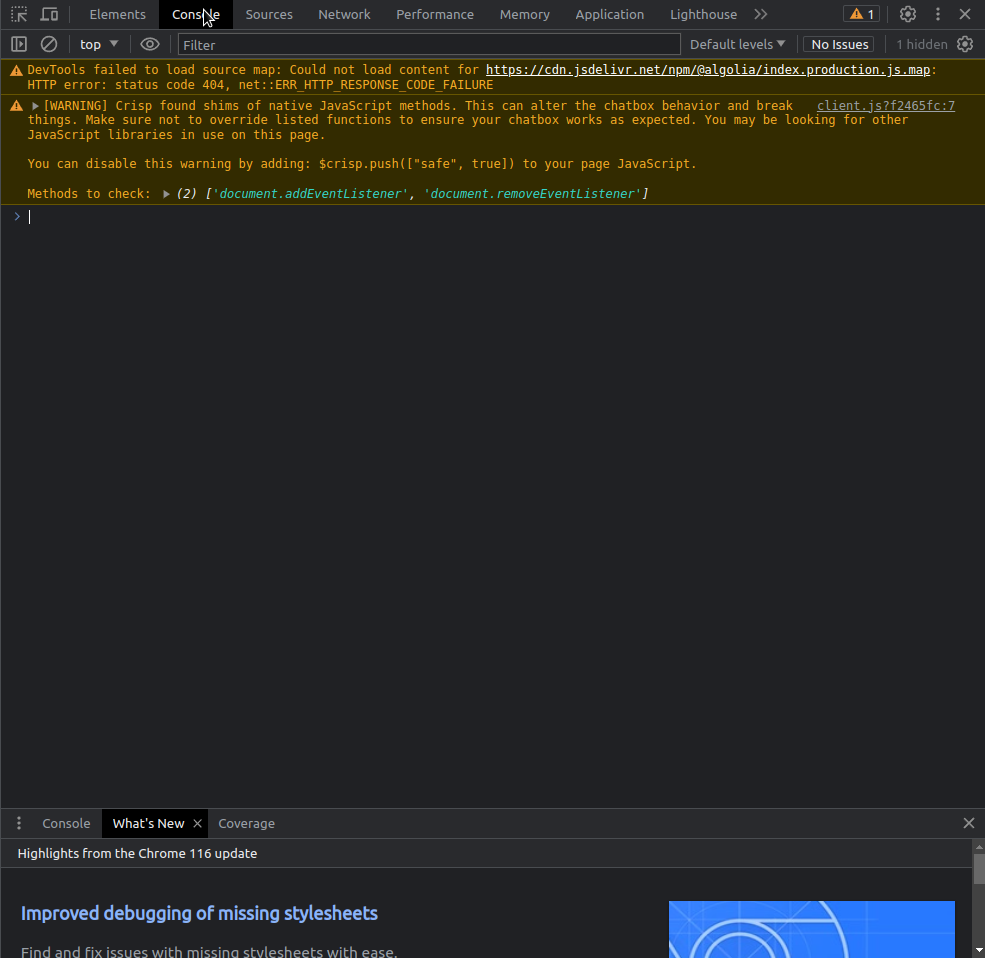
In the developer console, you’ll find several tabs such as “Console,” “Elements,” “Sources,” and more. Click on the “Console” tab to access the console logs.

Step 3: Reproduce the Issue
To capture the relevant console logs, it’s often best to reproduce the issue you’re trying to diagnose. Perform the actions on the website that lead to the problem, and observe the console for error messages or unexpected behavior.
Step 4: Export Console Logs
Now that you have identified the relevant logs, it’s time to export them. Most developer consoles provide options to export the console logs in various formats:
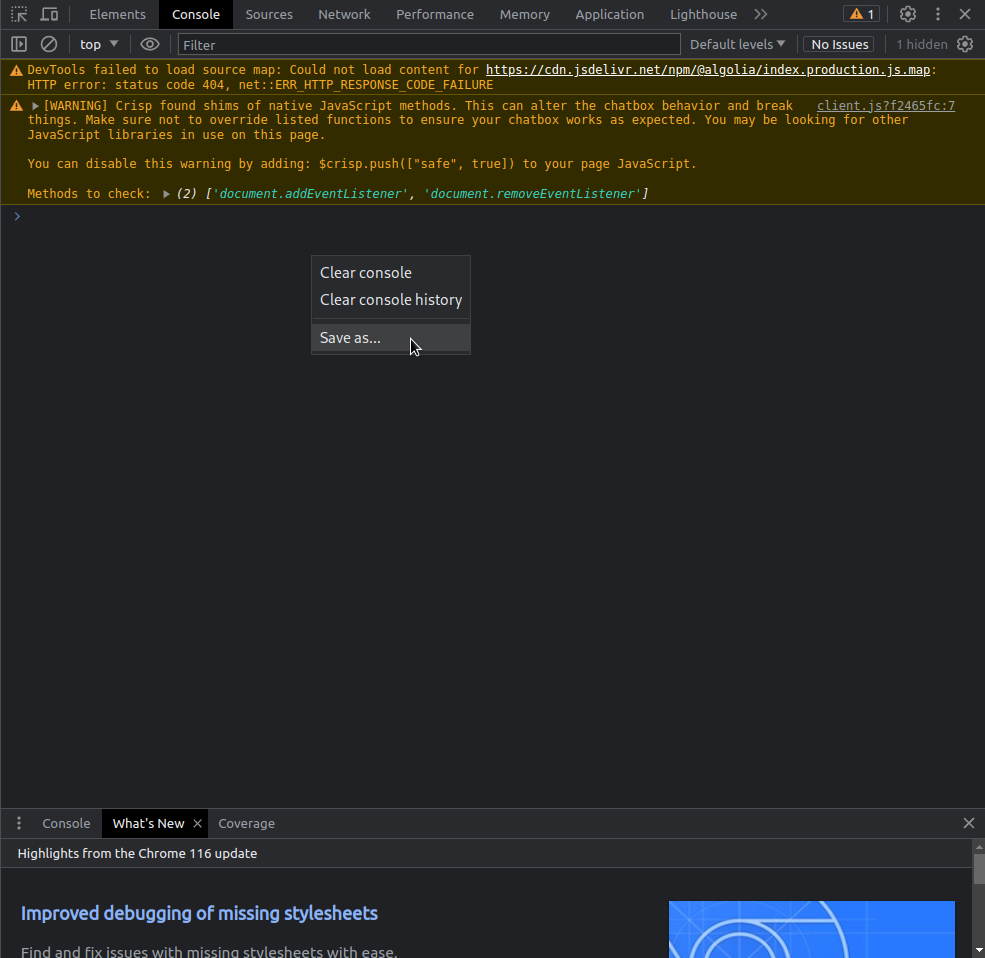
- In Chrome, you can right-click in the console area and select “Save as…” to save the logs as a text file.
- In Firefox, right-click in the console area and choose “Save as…” to save the logs.

Step 5: Save the File
Choose a suitable location on your computer to save the exported file. It’s a good practice to give the file a meaningful name that reflects the date and the issue you’re investigating. This will make it easier to organize and reference your logs later.
Conclusion
Console logs are a lifeline for web developers when it comes to diagnosing and fixing issues on websites. By following these simple steps, you can easily access, capture, and download console logs from a website, aiding in effective debugging, error tracking, and performance optimization. Remember that the developer console is a powerful tool that offers various features beyond console logs, so take some time to explore its capabilities and become a more proficient developer.
Contents
Subscribe for latest updates
Share this article
Related posts
Get started today
Requestly isn’t available for download on mobile or tablets.
To download it, please open this page on a desktop PC and enter your email to get the link.


- Local Projects
- Organize API into Collections & Environments
- API Tests
- Import from Postman, OpenAPI, etc


- Redirect URLs & modify HTTP headers
- Mock API / GraphQL responses
- Insert custom JavaScript scripts


