Best 20 Advance Chrome DevTools Debugging Tips
Your lightweight Client for API debugging
No Login Required
Requestly works on desktop.
Enter your email below to get the download link and try it when you’re on your PC.


If you’re a front-end developer or a QA, you know that Chrome Devtools is your go-to tool for debugging web applications. Besides the regular element inspector, the devtools offers several useful features that give you a deeper sneak peek into the inner workings of a web application. One such feature is the network tab, which allows you to inspect network requests sent from an application.
This guide will explore advanced HTTP debugging techniques by diving into the Network tab available in Chrome DevTools. Let’s dive in!
1. Disable Caching
Web browsers frequently store network requests in their internal cache. In modern web applications, substantial amounts of data are cached from these requests to enhance the user experience. Nonetheless, caching can be problematic when engaged in local development or debugging.
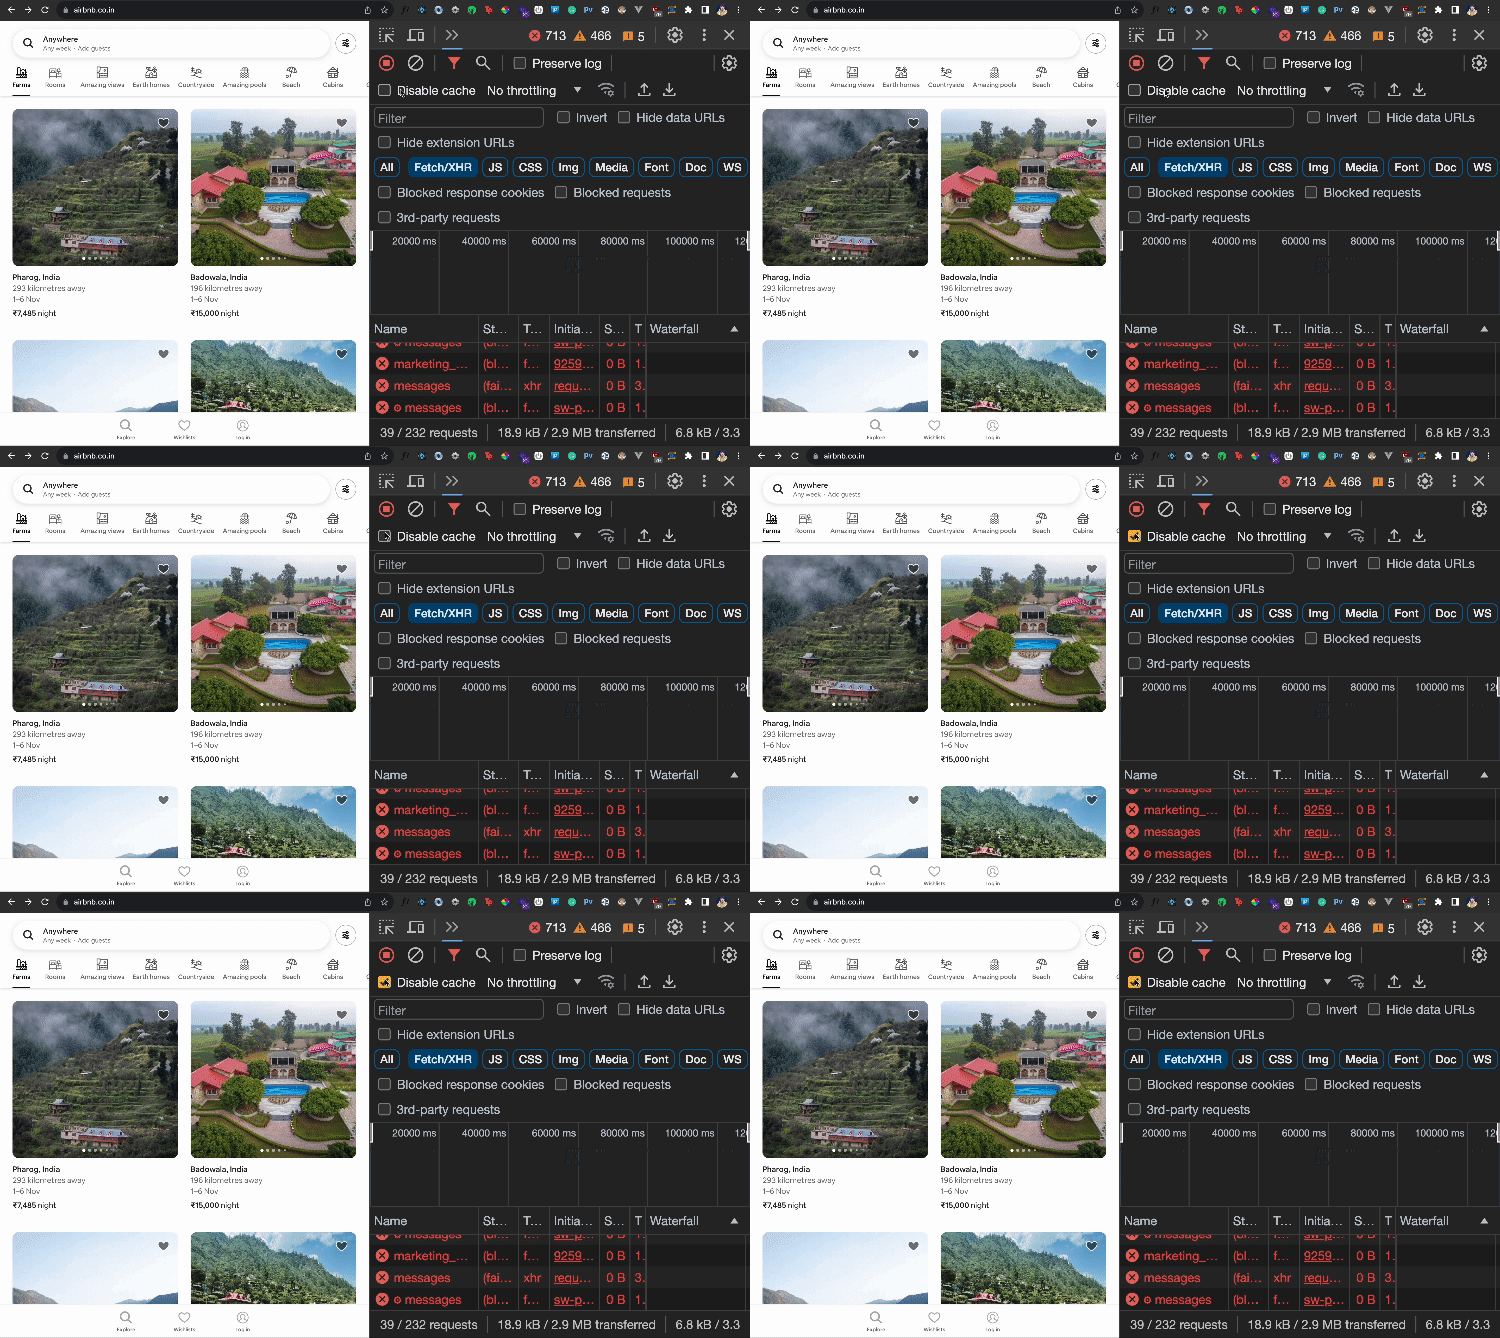
To disable caching in Chrome DevTools:
- Open DevTools (F12 or Ctrl/Cmd+Shift+I)
- Click on the Network tab
- Check the “Disable cache” option.
How to Clear Cache
When you browse any web page, lots of resources get cached. Chrome allows you to clear the entire cache using a straightforward shortcut. To accomplish this, navigate to your browser’s refresh button, right-click it, and choose “Empty Cache and Hard Reload.” This action will purge all the cached data associated with the application. When you reload the application, all data will be freshly retrieved from the network requests.
The duration for how long a resource (script, stylesheet, or Image) is cached depends upon the cache-control HTTP header returned by the server. If you need to test caching for different resources in your browser, you can use Requestly Modify HTTP Header Rule to manipulate the values of cache-control and test the behavior in your web application.
2. Inspecting Cookies
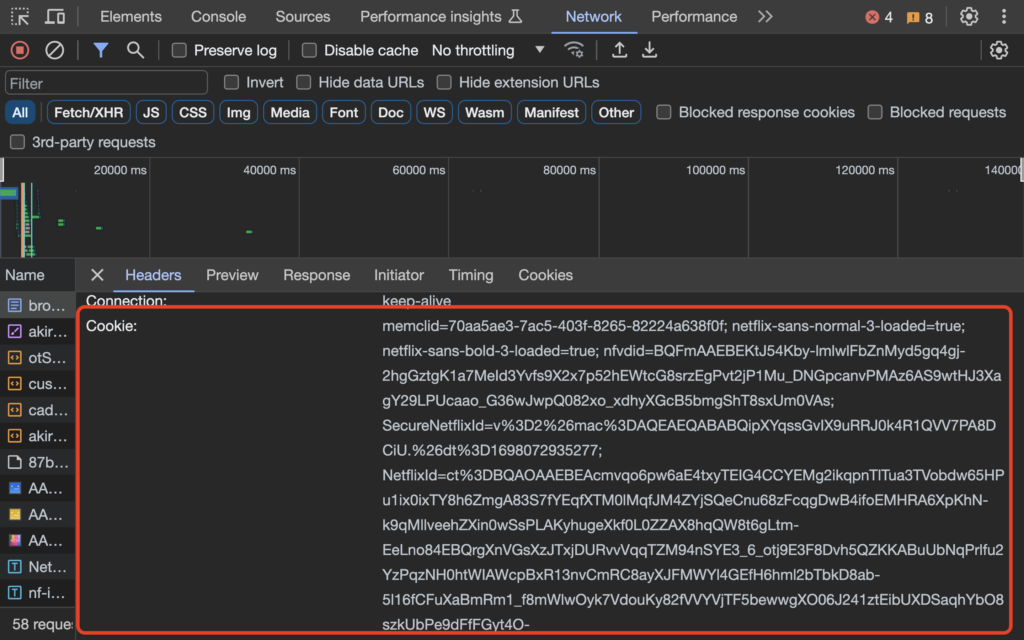
Applications extensively use cookies to gather user activity data, store authentication tokens, and perform various other functions. You can scrutinize and review the cookies received by an application through a particular request using the Network tab.
- Open DevTools (F12 or Ctrl+Shift+I)
- Go to the Network tab
- Click on the request you’re interested in
- You’ll find the
Cookieheader in the Headers section, showing the cookies associated with that request.
3. Throttle Requests
The era of empty pages caused by slow internet connections is behind us. Developers create applications that perform smoothly even under the most challenging network conditions. Developers and QAs must frequently evaluate how their applications function in sluggish network speed scenarios.
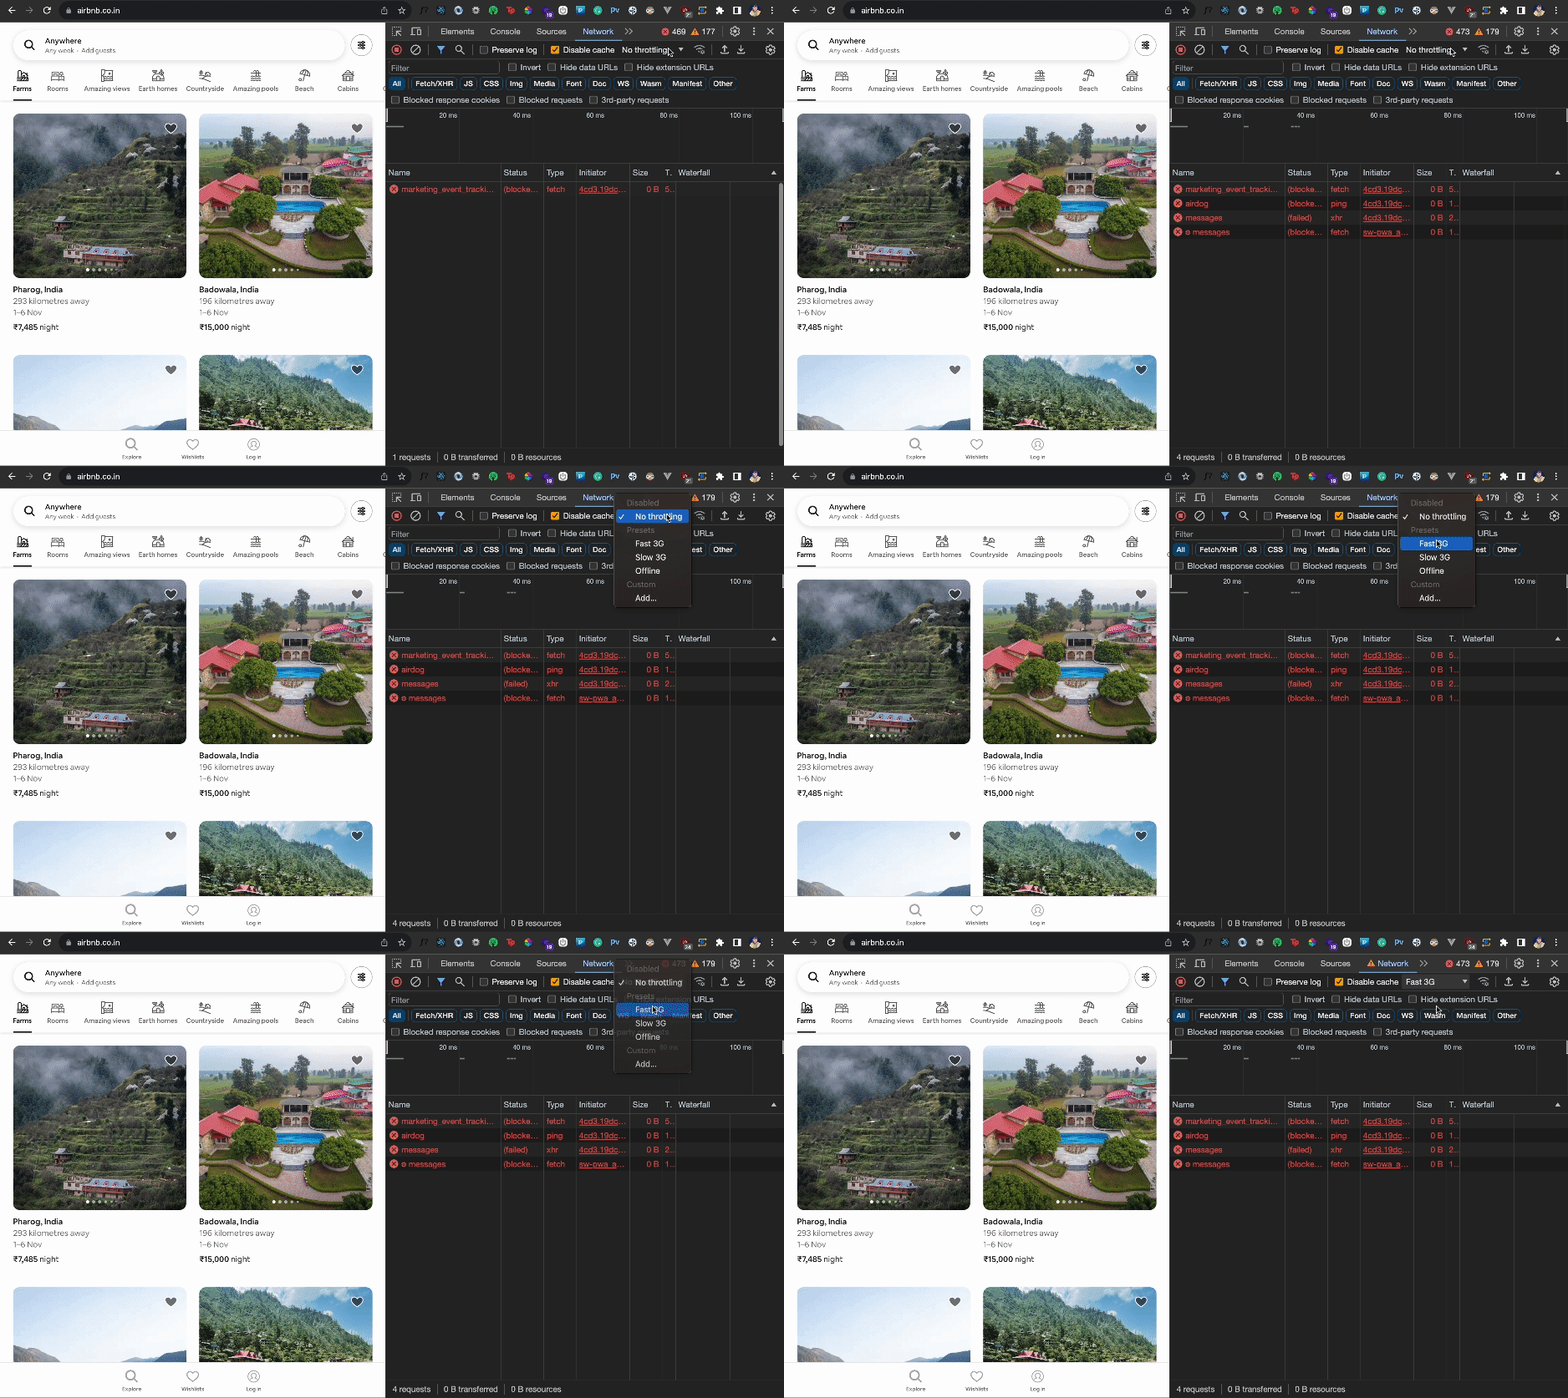
To address this need, you can mimic specific network conditions to restrict the speed of requests. This includes emulating 3G, 2G, and even complete offline conditions.
- Open DevTools (F12 or Ctrl+Shift+I)
- Go to the Network tab
- Click on the “No Throttling” Menu
- Select one of the presets from “Fast 3G”, “Slow 3G,” and “Offline”.
Nonetheless, there is a limitation in the Network tab: it applies a particular throttling condition to all requests on a webpage. But what if you need to test one or more network requests under distinct throttling conditions? For finer control, you can utilize Requestly, a tool that empowers custom throttling for individual requests. You can set time-bound delays for individual requests by creating an HTTP Delay Request Rule on a particular request.
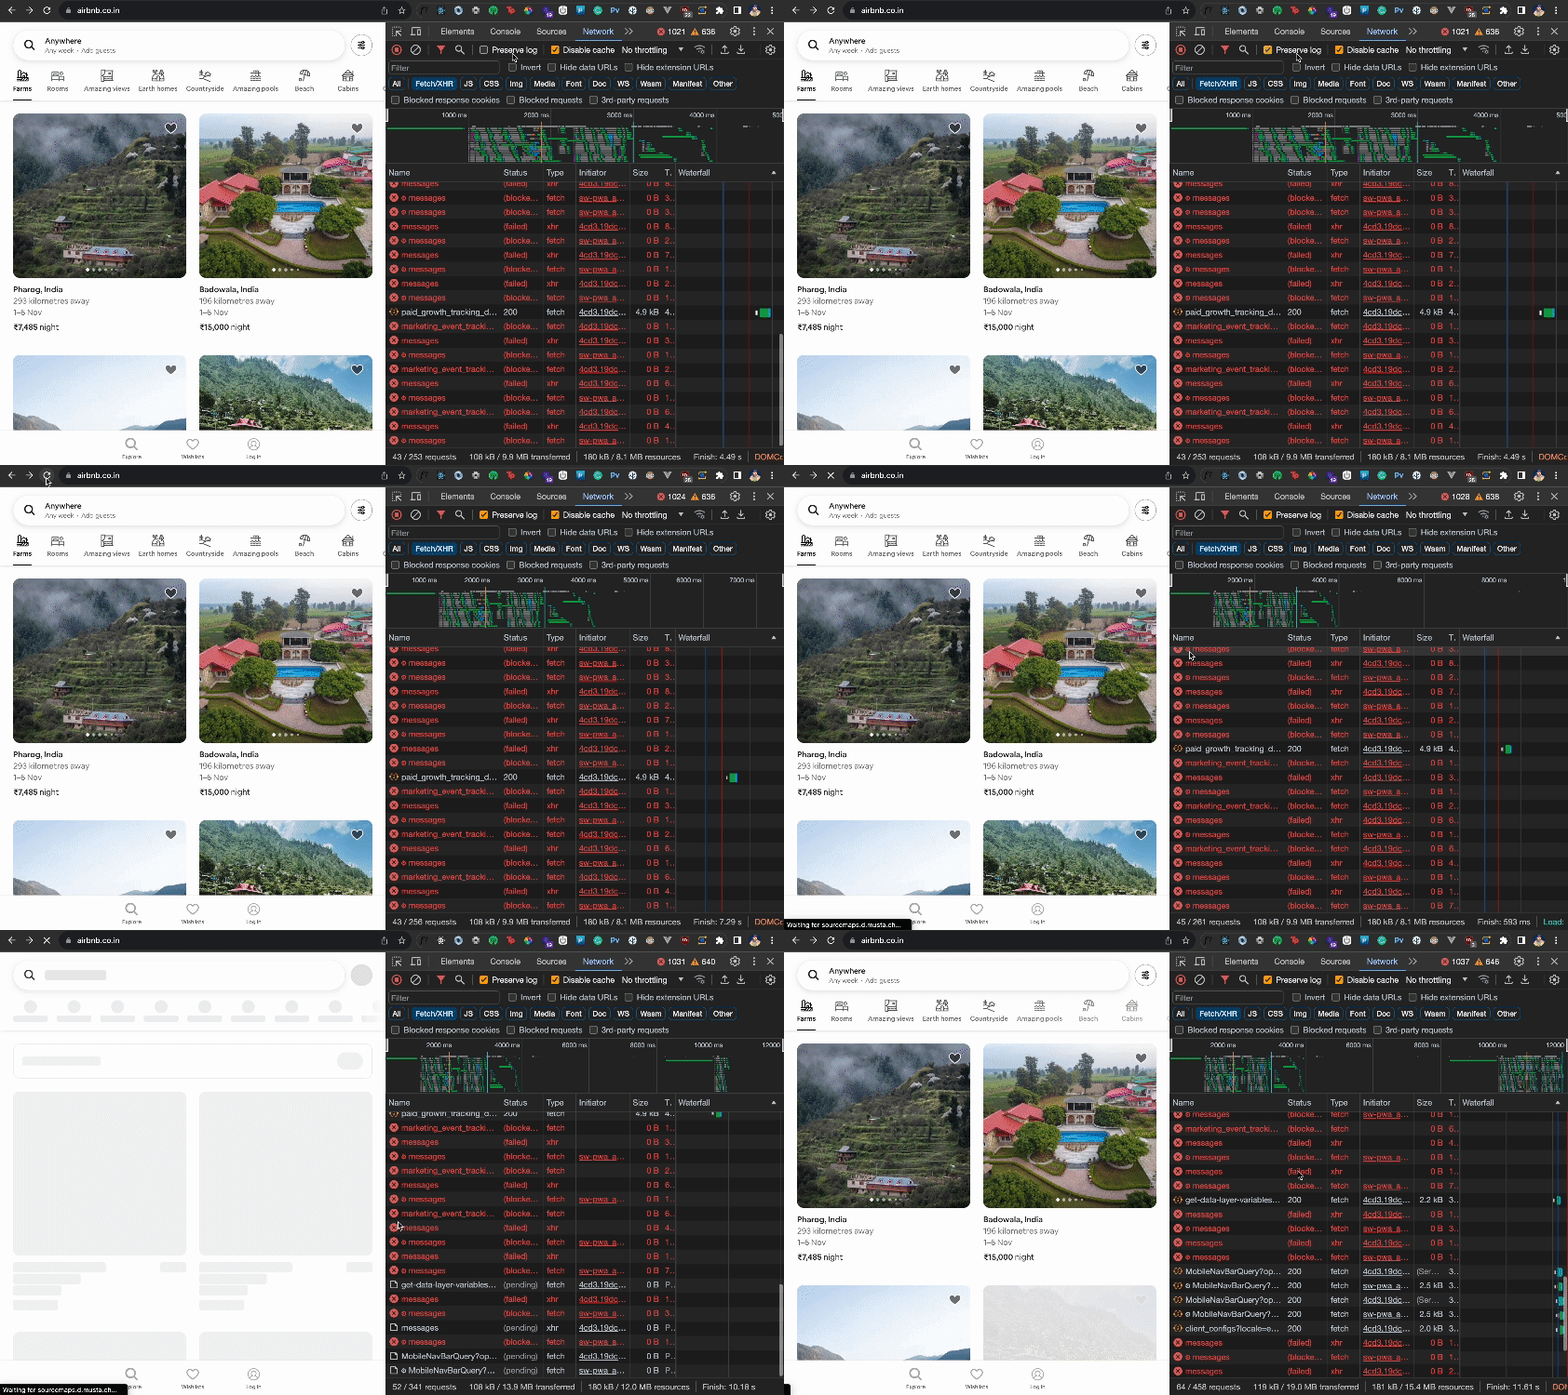
4. Preserve Log
When you refresh a page, the network tab typically clears the current page’s requests to display the new ones. However, when comparing the requests on fresh page renders, you might need to preserve the previous requests in the network tab even on page refresh.
The Preserve Log option ensures that network requests remain in the Network tab even after page navigation. This can be handy for debugging sessions.
Here’s how you can do this:
- Open DevTools (F12 or Ctrl+Shift+I)
- Go to the Network tab
- Check the “Preserve log” box.
5. Waterfall Timeline
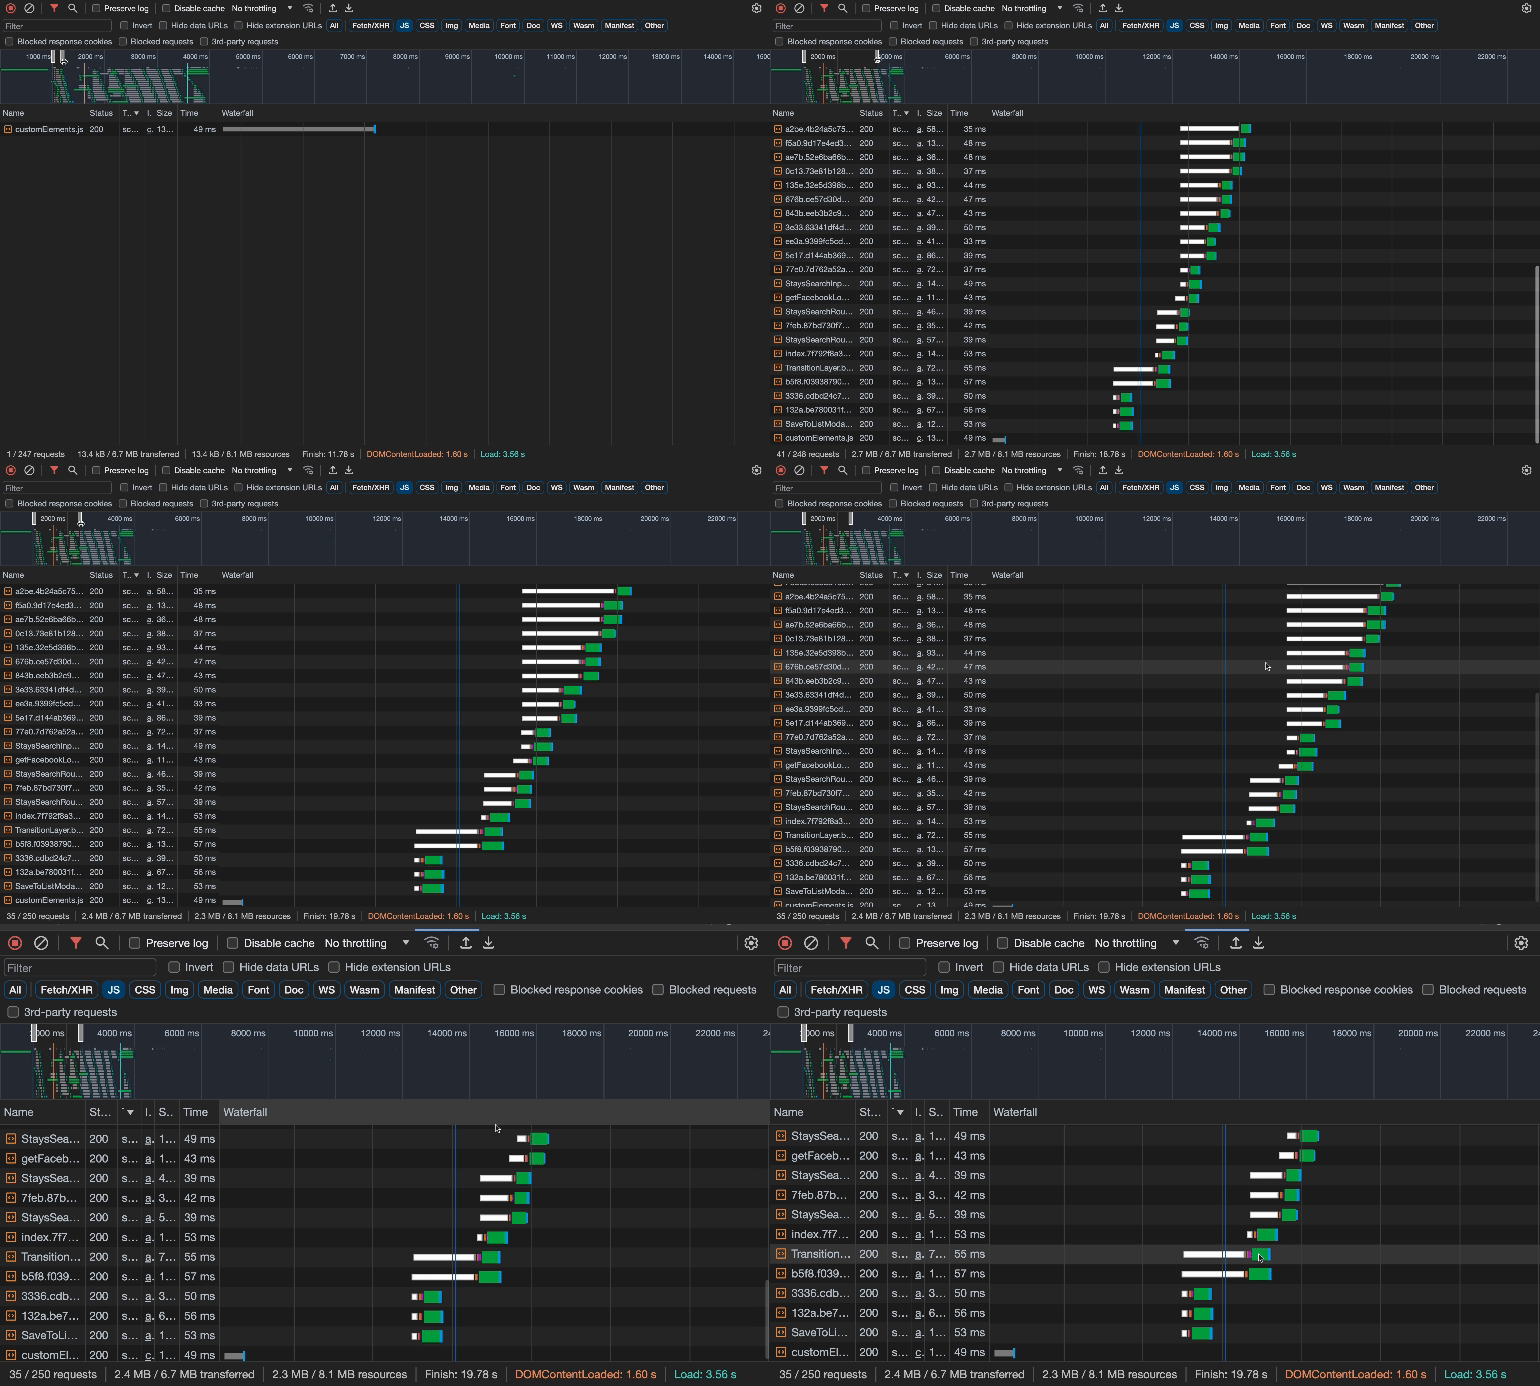
In some cases, one or more requests perform slower than usual or slower than the rest. In such cases, it’s helpful to see these requests side by side to understand which requests are loading resources slowly.
For this, the Network tab provides a Waterfall Timeline that can be used to identify slow-loading requests and resources so developers can optimize these requests and the overall user experience of the application. The Waterfall Timeline tells you how long it took for a request to load and gives you the breakdown of each request. This includes the time taken for an SSL connection to be established, the content to be downloaded, and the server to respond.
Here’s how you can do this:
- Open DevTools (F12 or Ctrl+Shift+I)
- Go to the Network tab
- Look at the “Waterfall” section to inspect the Waterfall Timeline of network requests.
6. Download Network Dump as HAR File
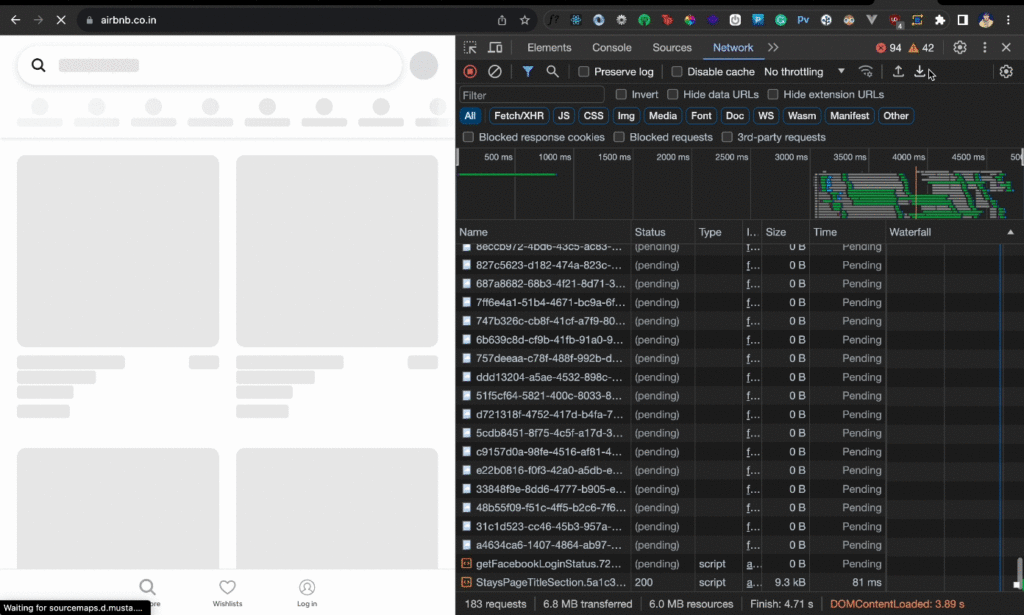
You can export the entire network activity as an HTTP Archive or a HAR file and share it with your team for further analysis.
Here’s how you can do this:
- Open DevTools (F12 or Ctrl+Shift+I)
- Go to the Network tab
- Click on the Download icon or the “Export HAR” option:
For a more comprehensive solution, consider using Requestly’s SessionBook. You can use sessions to share network requests stitched with console logs & browsing sessions. For instance, the following session replay shows all the network requests alongside any warnings, errors, or messages in the console about that browning session.
7. Inspect HTTP Request & Response Headers
Chrome DevTools allows you to inspect a network request’s HTTP request and response headers. Headers often contain information such as cache, cookies, authentication tokens, etc, that may be essential for debugging network requests.
To do this:
- Open DevTools (F12 or Ctrl+Shift+I)
- Go to the Network tab
- Click on a request
- Request Headers & Response Headers.
However, Devtools is limited to only viewing the request and response headers. You can use Requestly to modify HTTP request and response headers.
8. Inspect Request Payload & Response Body
Like inspecting HTTP headers, you can look at the request payload sent with the HTTP request and the exact response sent back by the server. This can be extremely helpful when you’re debugging APIs and how various responses are handled by the front end.
To do this:
- Open DevTools (F12 or Ctrl+Shift+I)
- Go to the Network tab
- Click on a request
- The payload/Preview Tab and Response Tab show the request payload and response body, respectively.
Inspecting request payloads and response bodies is crucial for debugging APIs. Using Requestly, you can modify the request payload and response body of APIs.
9. Edit, Replay, and Exporting Requests as fetch/cURL
You can also use the DevTools to replay network requests. Firefox has an option to “resend” a network request directly. However, in Chrome, you can copy the request as a curl command or fetch command and run the request again.
- Open DevTools (F12 or Ctrl+Shift+I)
- Go to the Network tab
- Right Click on a request
- Select Copy
- Copy as fetch/Copy as curl
10. Customize Columns
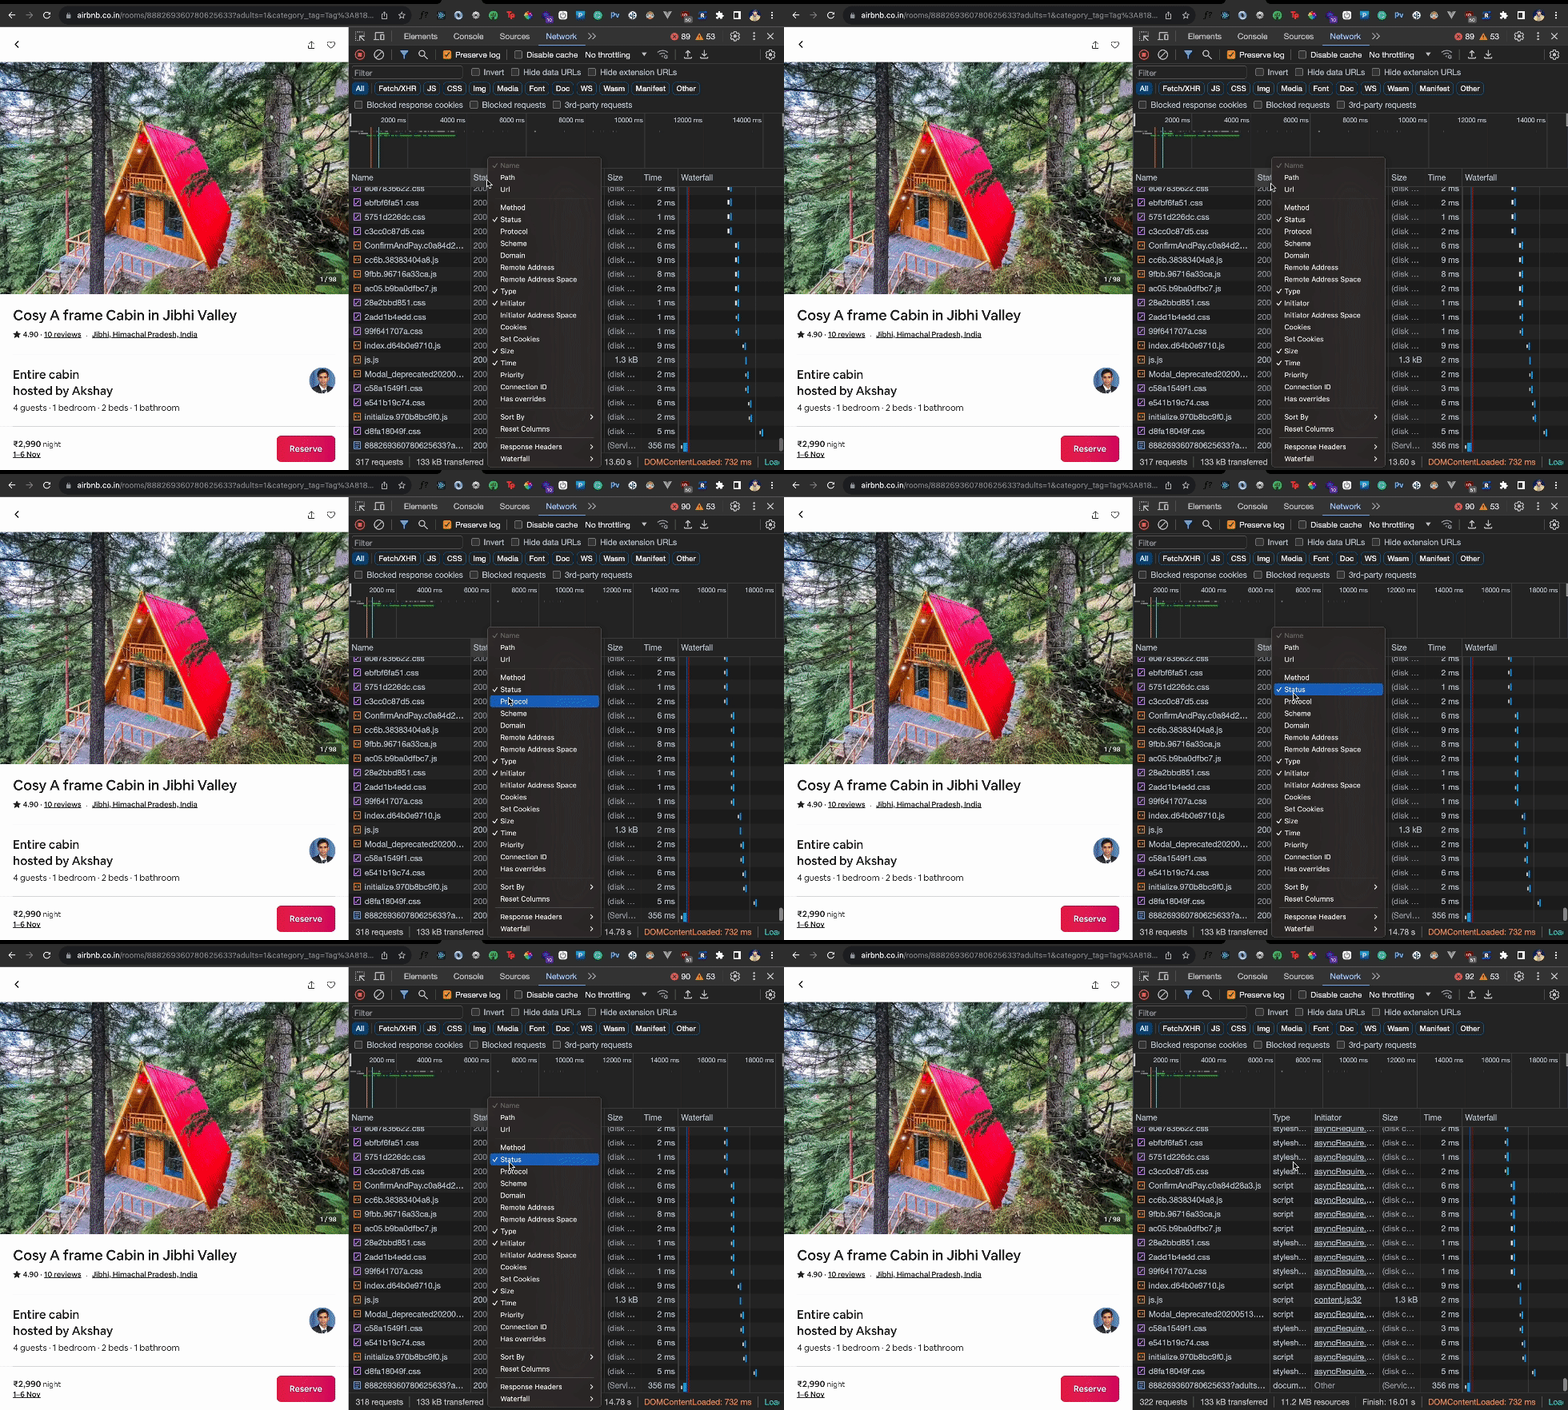
The columns displayed against each network request can be customized accordingly to you. You can remove or add any column based on the information you want to see for a particular request.
You can customize the columns displayed in the Network tab by right-clicking on the column headers and selecting/unselecting the information you need.
- Open DevTools (F12 or Ctrl+Shift+I)
- Go to the Network tab
- Go to the network tab columns
- Right-click on a column
- Select/Unselect a column name
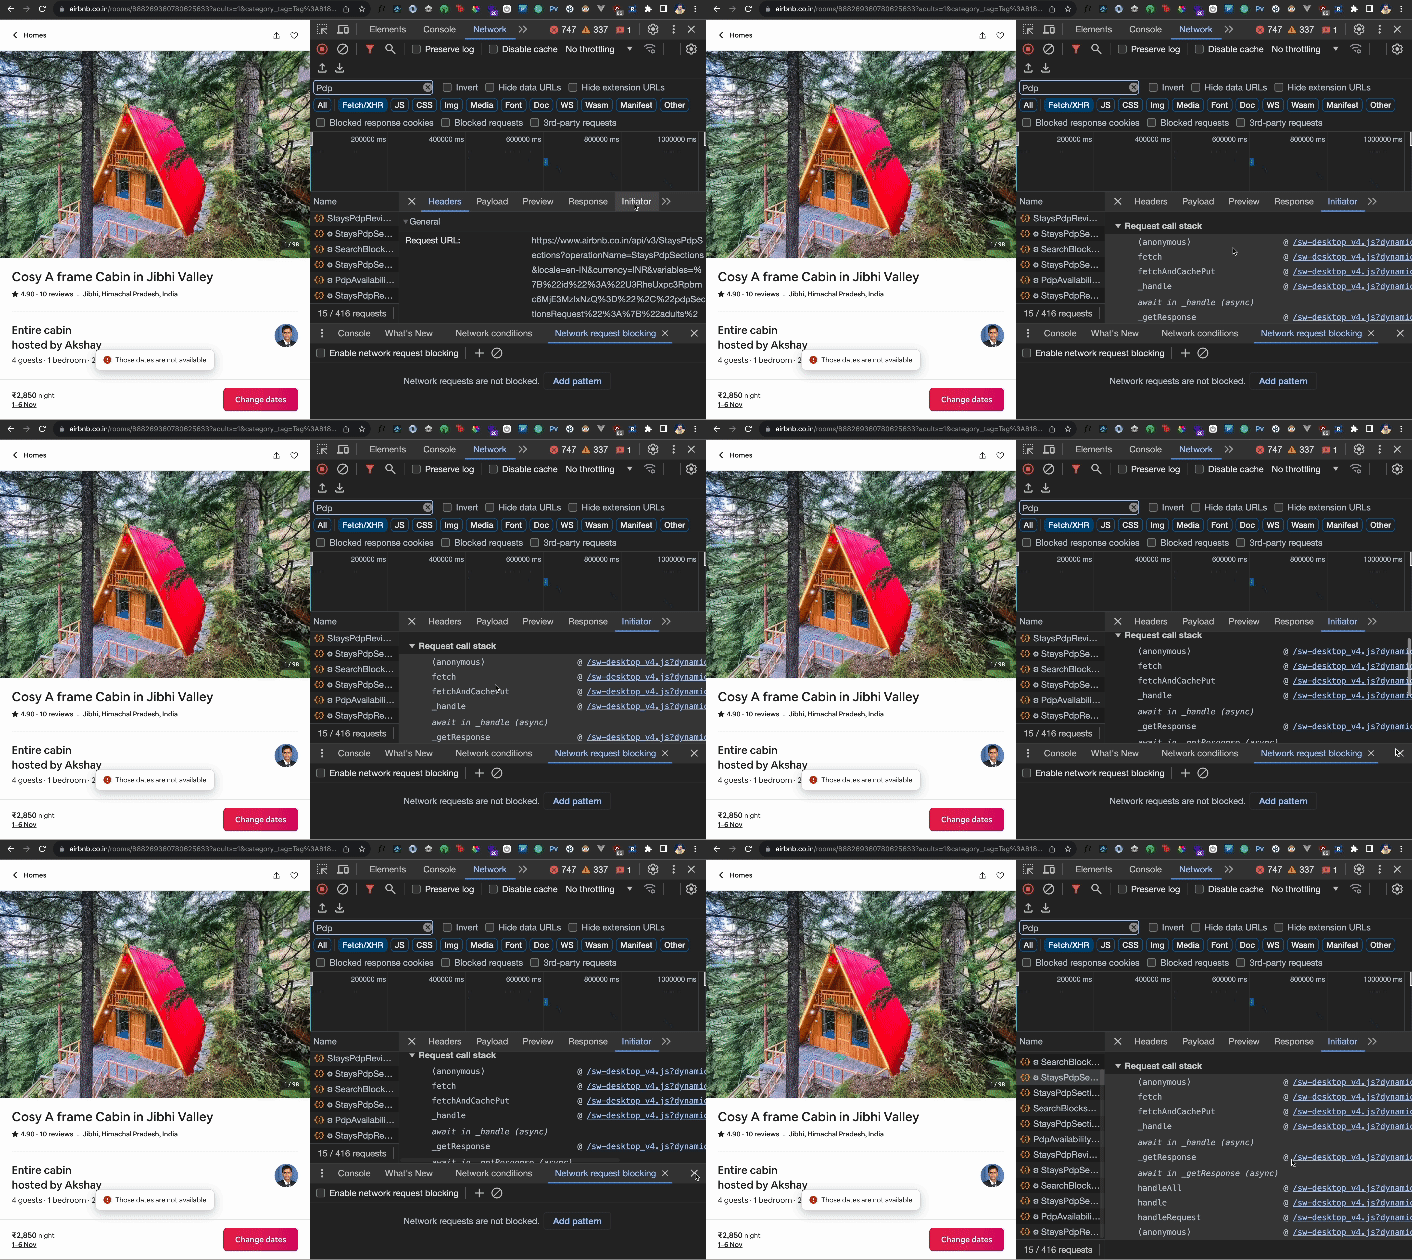
11. Initiator Call Stack
You can use the Initiator column to know the exact trigger that leads to a particular network request. You can then see if a script, a redirect, or an external website triggered this request. This can be handy when you want to debug a request causing bugs or unwanted behavior in your application.
- Open DevTools (F12 or Ctrl+Shift+I)
- Go to the Network tab
- Go to the network tab columns
- Initiator column
12. XHR Breakpoints
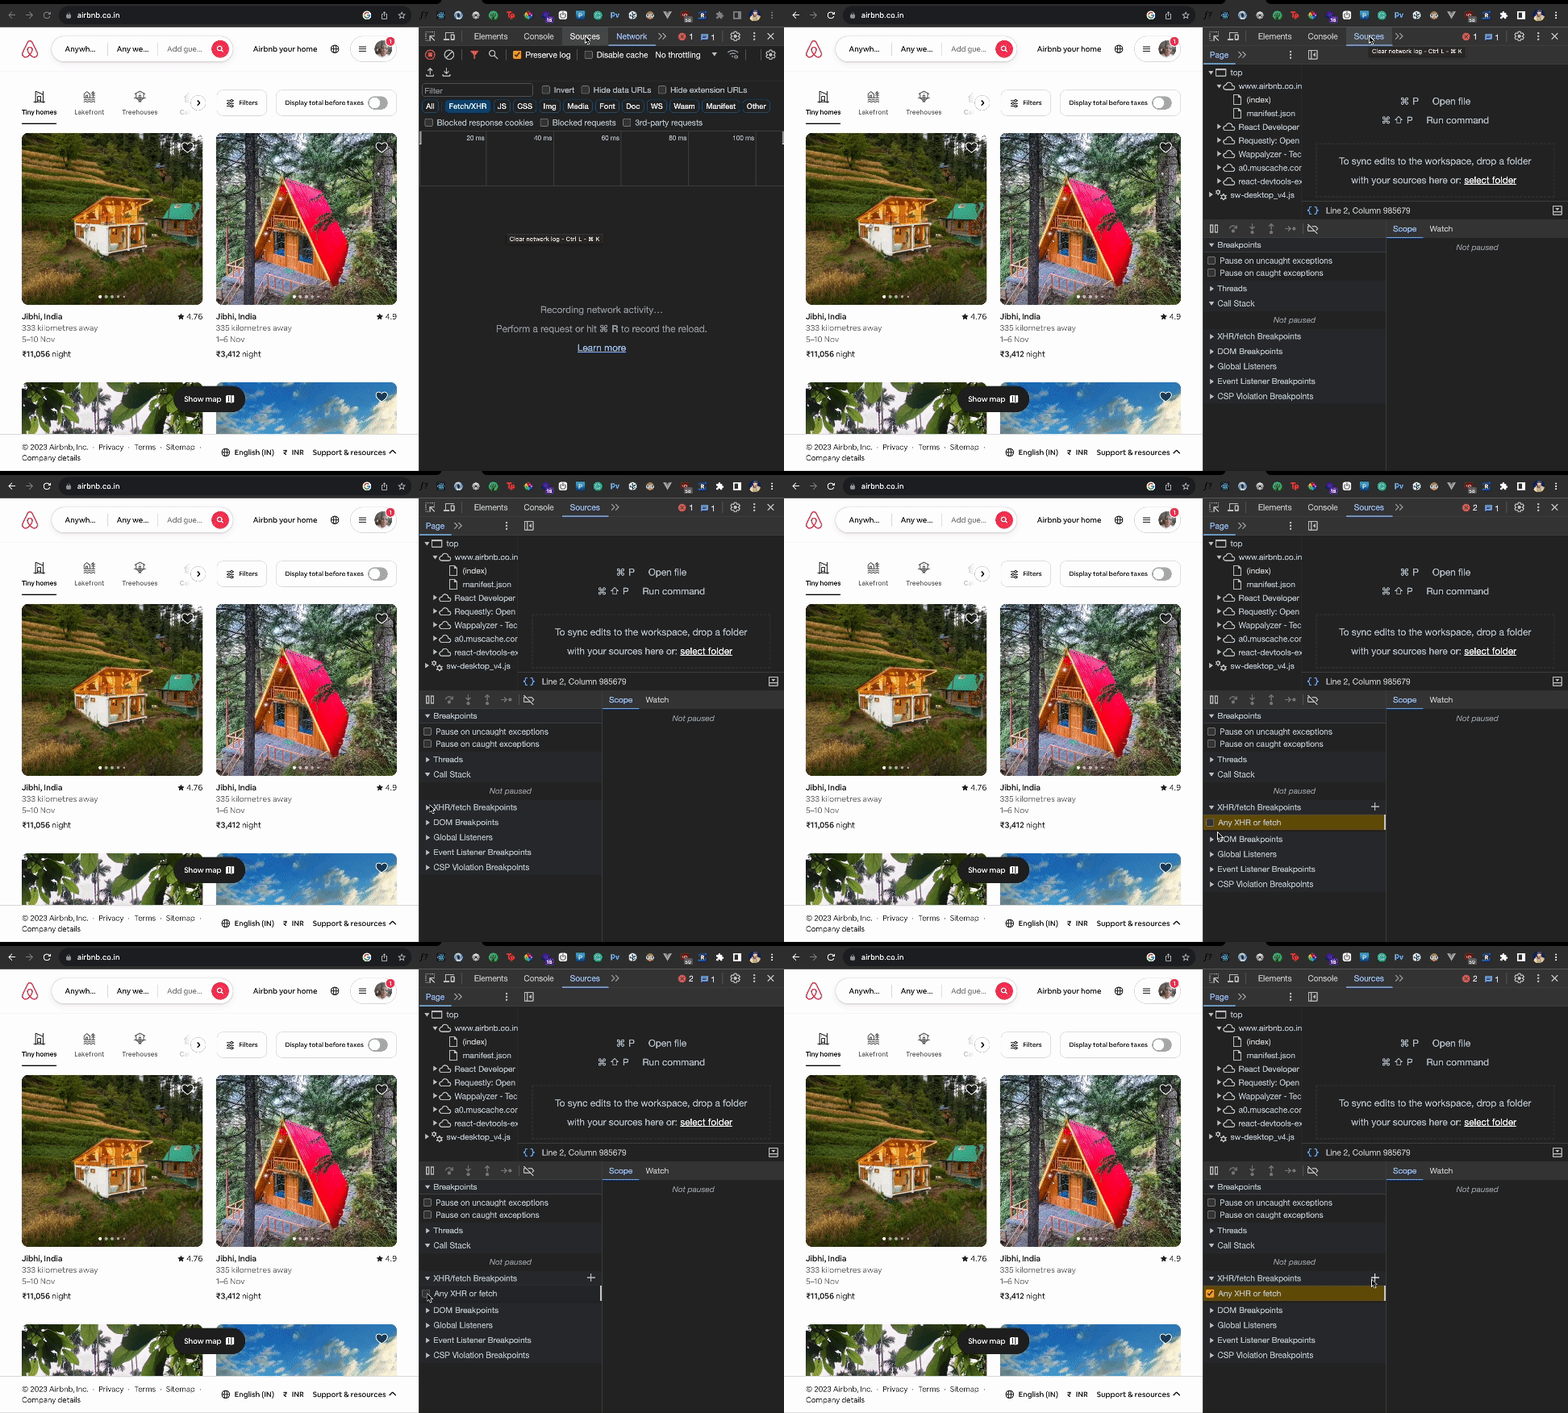
You can set breakpoints in executing network requests using the XHR Breakpoints tab. This will pause the execution of any JavaScript requests and show you the exact code from where the request is made. This can be incredibly useful for debugging AJAX calls.
- Open DevTools (F12 or Ctrl+Shift+I)
- Sources
- XHR/Fetch Breakpoints
- Select “Any XHR or fetch”
13. WebSocket Inspection
Messaging, streaming, and chat applications use WebSockets instead of direct Request-Response structure for communication. The network tab can be helpful to debug and inspect the WebSocket traffic to an application. You can find WebSocket frames under the “WS” tab in the Network panel. When you apply a fetch filter to your Network requests, you can select the “WS” tab to see all the WebSocket requests for a particular application.
- Open DevTools (F12 or Ctrl+Shift+I)
- Go to the Network tab
- Select
WStab
Encryption is an interesting piece of software art for developers; we’ve gone in-depth in a blog where we decode WhatsApp’s end-to-end encryption to understand how it works.
14. Search & Filter
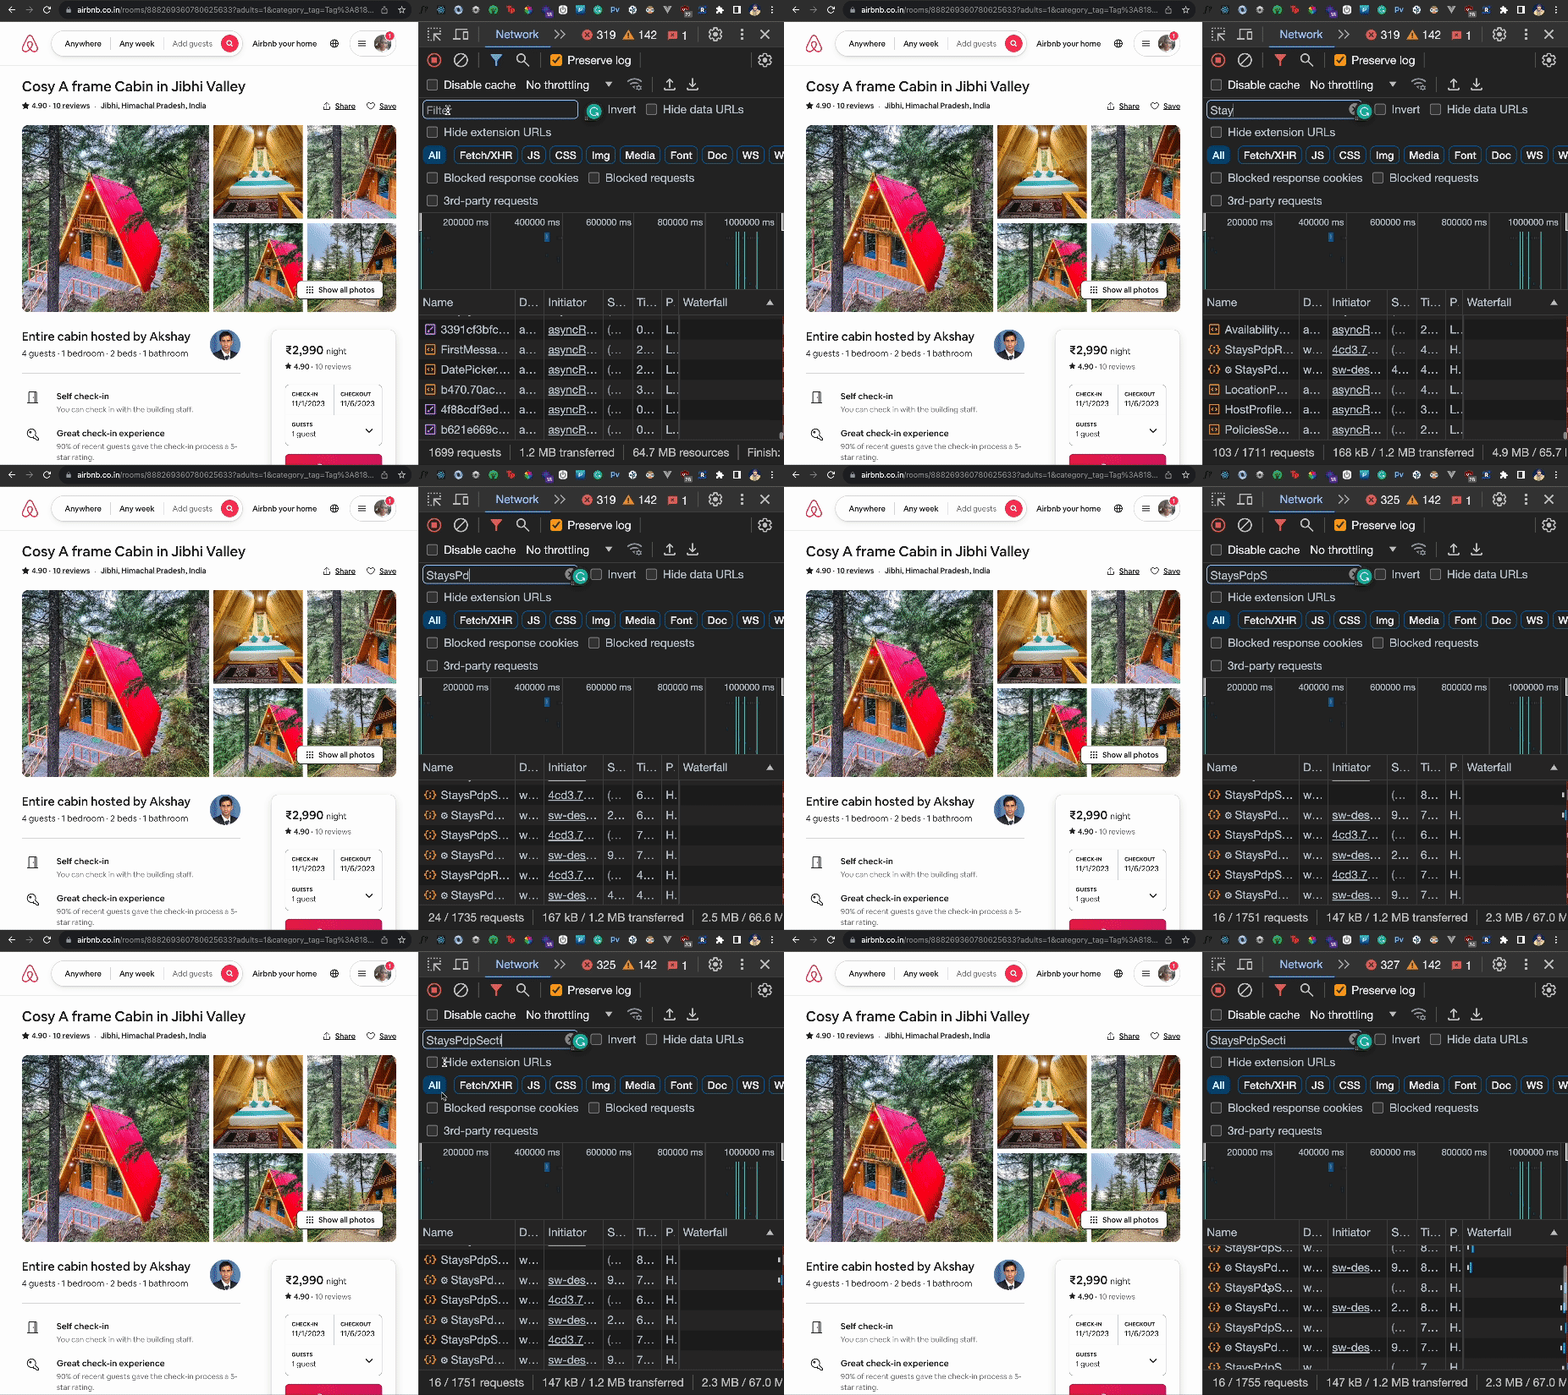
Popular websites make numerous network requests to get the application’s data, assets, fonts, images, HTML pages, and more. It’s common for developers to get lost in the sea of network requests. Using the search bar in the Network tab, you can quickly filter a specific request using the domain, file type, and URL.
- Open DevTools (F12 or Ctrl+Shift+I)
- Go to the Network tab
- Use the Filter bar
15. Blocking Requests
DevTools allows you to block specific requests to an application using the Block Request URL feature. Testing how your application handles missing resources and how these scenarios are conveyed to the end user can be extremely useful.
- Open DevTools (F12 or Ctrl+Shift+I)
- Go to the Network tab
- Select a Network Request > Right Click > Block Request URL
We tried this out on AirBnb, and they showed an error message to the user:
19. Request Prioritization
A website loads several resources in the background to render the user interface on the page. Each resource is associated with a network request, and each network request has a said priority based on which these resources are loaded.
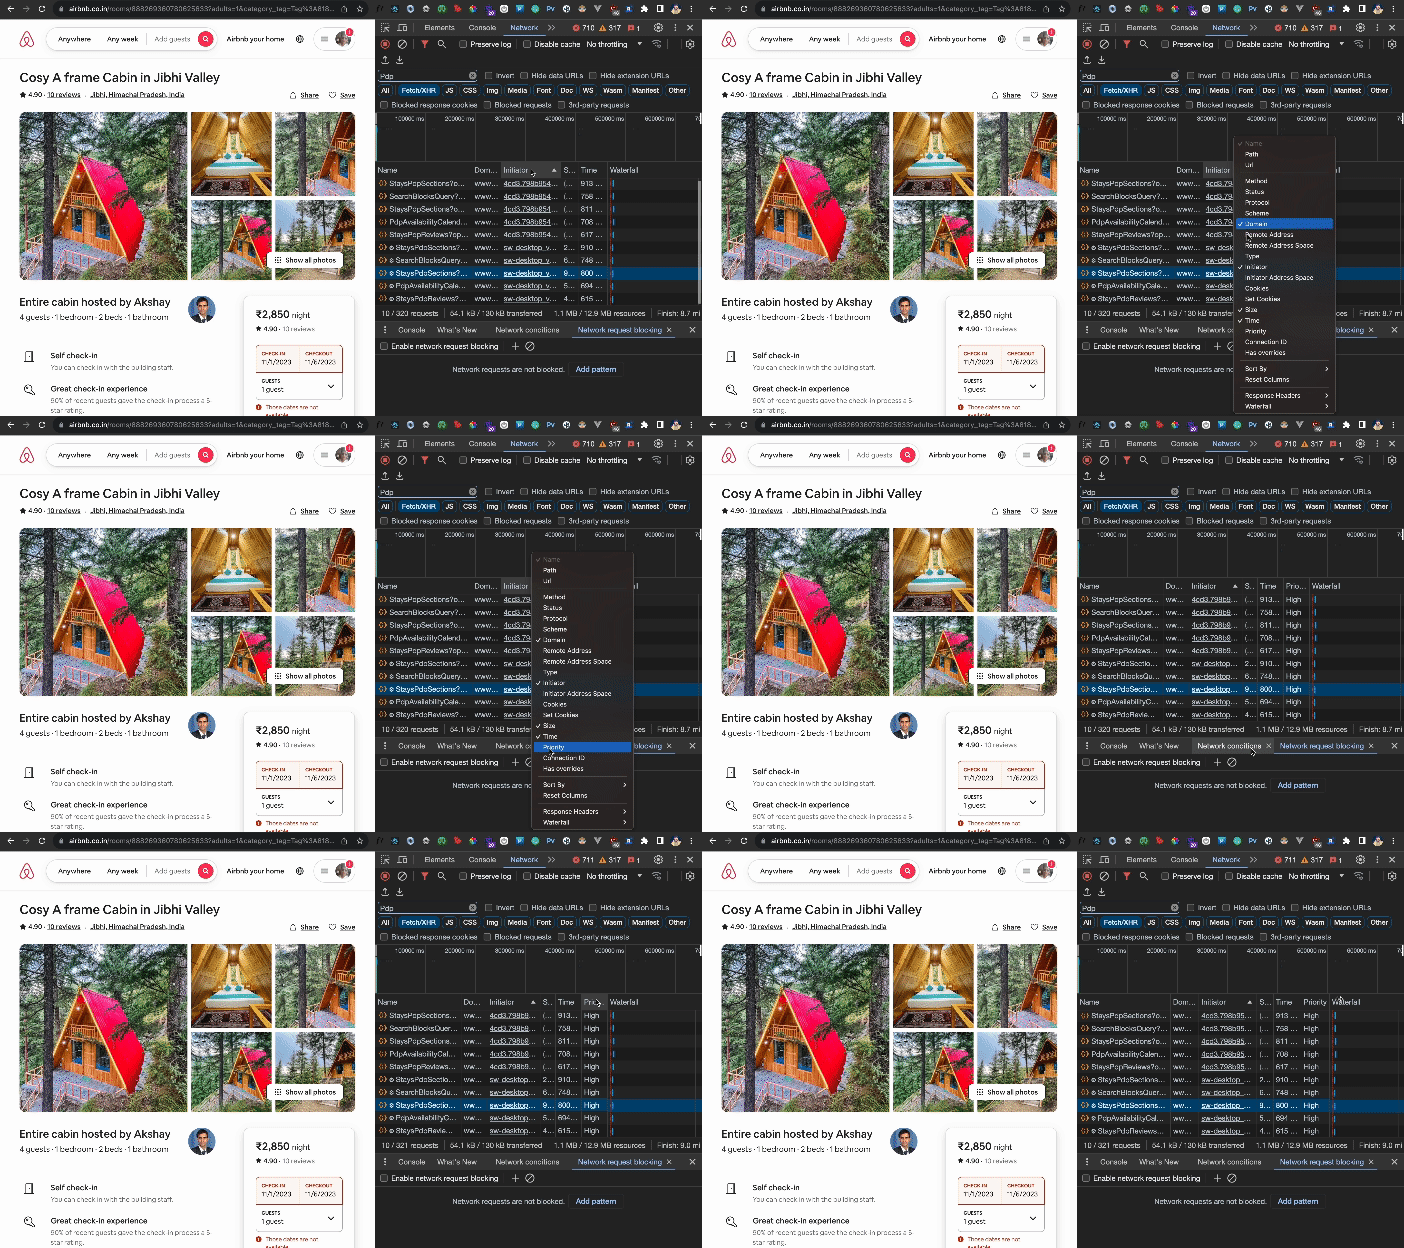
You can see the priority of these requests by enabling the Priority column in the network tab. This can help you understand if some of your high-priority requests take a long time to load.
- Open DevTools (F12 or Ctrl+Shift+I)
- Go to the Network tab
- Network Tab Headers
- Right Click on a Column name
- Select Priority
20. Request Timing Breakdown
The Waterfall Timeline can help compare how network requests perform against one another. However, you can even understand how each request performs using the timing breakdown of each network request. This will help you discover if a particular request is performing as expected or experiencing performance bottlenecks.
- Open DevTools (F12 or Ctrl+Shift+I)
- Go to the Network tab
- Click on a request > Go to the
Timingtab
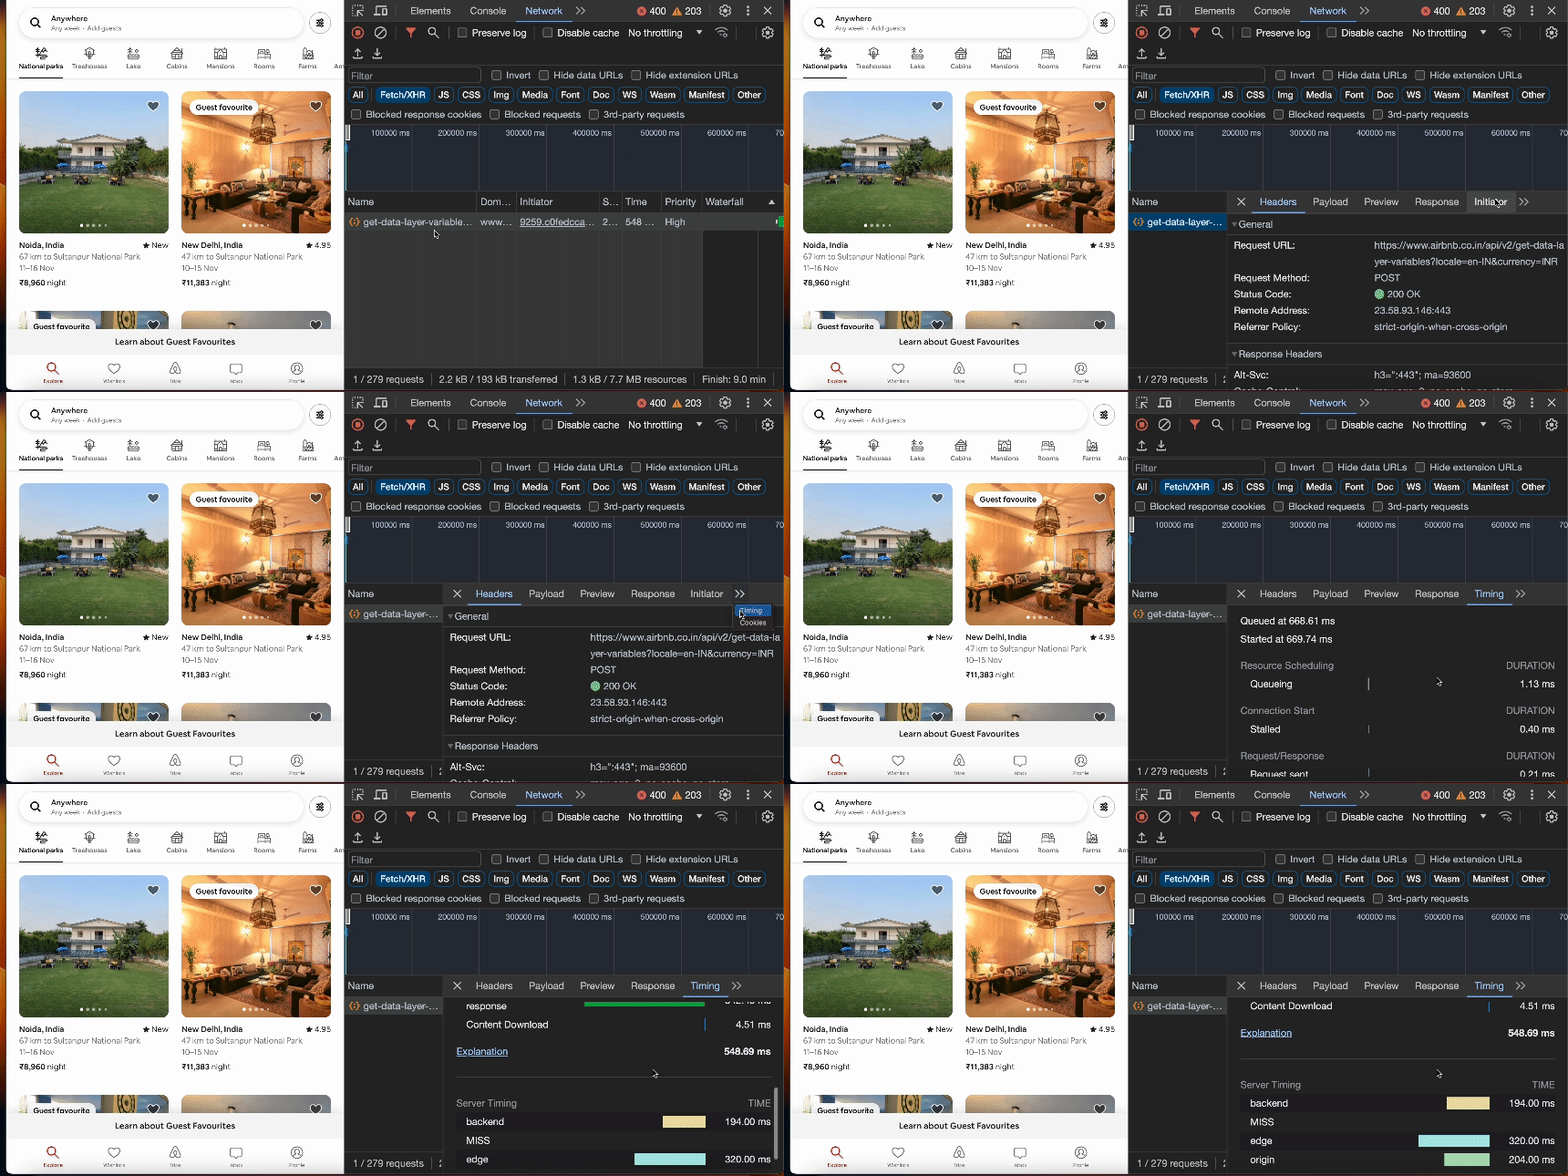
You can then understand the different timing phases, such as queueing, stalled, DNS lookup, TTFB, etc, that constitute the overall time the request takes to respond. This can be extremely helpful in understanding where and why a request has a slugging response.
Limitations of Chrome DevTools
While Chrome DevTools is a powerful tool for web development and debugging, it has limitations. Some of these include:
- Inability to modify network requests
- Limited support for handling specific scenarios like advanced request throttling or precise request mocking.
- Limited to the browser’s capabilities, some issues related to server-side or complex interactions need to be fully debuggable.
We’ve seen that by using external tools like Requestly, you can overcome some limitations of developer tools, such as making extensive modifications to the requests or setting custom throttling conditions.
Conclusion
In conclusion, mastering the Chrome DevTools Network tab is invaluable for front-end developers and QA professionals. While it has its limitations, it offers a wealth of features for advanced HTTP debugging. Combining it with tools like Requestly can take your web development and debugging to the next level.
Contents
- 1. Disable Caching
- How to Clear Cache
- 2. Inspecting Cookies
- 3. Throttle Requests
- 4. Preserve Log
- 5. Waterfall Timeline
- 6. Download Network Dump as HAR File
- 7. Inspect HTTP Request & Response Headers
- 8. Inspect Request Payload & Response Body
- 9. Edit, Replay, and Exporting Requests as fetch/cURL
- 10. Customize Columns
- 11. Initiator Call Stack
- 12. XHR Breakpoints
- 13. WebSocket Inspection
- 14. Search & Filter
- 15. Blocking Requests
- 19. Request Prioritization
- 20. Request Timing Breakdown
- Limitations of Chrome DevTools
- Conclusion
Subscribe for latest updates
Share this article
Related posts
Get started today
Requestly works on desktop.
Enter your email below to get the download link and try it when you’re on your PC.


