How to Use Session Book To Debug Faster

Your lightweight Client for API debugging
No Login Required
Requestly isn’t available for download on mobile or tablets.
To download it, please open this page on a desktop PC and enter your email to get the link.



- Local Projects
- Organize API into Collections & Environments
- API Tests
- Import from Postman, OpenAPI, etc


- Redirect URLs & modify HTTP headers
- Mock API / GraphQL responses
- Insert custom JavaScript scripts
Session recording refers to the process of capturing and recording the interactions and activities of users on a website or web application. This recording typically includes the actions users take, such as clicking buttons, filling out forms, navigating between pages, and other interactions. It can also capture user input, mouse movements, scrolling behaviour, and more. These tools allow website owners, developers, and UX designers to gain valuable insights into how users are actually using their website or application. This data can be used for various purposes:
User Experience Analysis: By observing real user interactions, you can identify usability issues, pain points, and areas where users might get stuck. This information helps improve the overall user experience.
Conversion Rate Optimization: Analyzing user behaviour through session recordings can help you identify conversion barriers and optimize your website to improve conversion rates.
A/B Testing and User Testing: Session recordings can be used to validate A/B tests and user testing by observing how users interact with different variations of a webpage.
Session recording tools often come with features such as:
- Playback: Viewing recorded sessions as a video playback of user interactions.
- Heatmaps: Visual representations of where users clicked, moved their mouse, or spent the most time on a webpage.
- Analytics and Filtering: The ability to filter and segment recordings based on specific criteria (e.g., new users, certain pages, geographic locations).
- Search and Tags: Adding tags or notes to specific moments within recordings for easy retrieval and analysis.
- Bug Reporting: Able to track the console and network logs so that it is easy to debug an issue faced by a user.
Why Session Recording can be useful in web debugging
As mentioned above, Session recording tools were often used to understand the user behaviour on the website. However, it emerges as an indispensable tool in the realm of web debugging due to its ability to provide an unfiltered, real-time glimpse into the intricate dance between users and web applications. By capturing the sequence of interactions, clicks, and scrolls as users navigate through the application, session recording becomes a virtual time machine, enabling developers to retrace the steps that lead to errors, glitches, or unexpected behaviours. This visual playback offers a comprehensive view of the user’s journey, highlighting precisely where bottlenecks occur, which elements trigger confusion, and how errors manifest.
Session recording can be incredibly useful in the process of web debugging for several reasons:
Accurate Reproduction of Issues: When users report bugs or issues on your website, session recordings allow you to see exactly what actions they took leading up to the problem. This makes it easier to reproduce the issue and understand the context in which it occurred.
Visual Context: Session recordings provide a visual context to the debugging process. You can see user interactions, mouse movements, clicks, and other actions as they happen in real-time, which can be immensely helpful in understanding the user’s perspective.
Interaction Patterns: By analyzing multiple session recordings, you can spot patterns in user behaviour and identify common paths users take through your website. This can help you understand how users are navigating and using your site.
Browser and Device Compatibility: Session recordings can reveal issues that are specific to certain browsers, devices, or screen sizes. You can identify rendering problems, layout issues, or JavaScript errors that may not be immediately apparent through traditional debugging methods.
Overall, session recording adds a layer of transparency and insight into the debugging process, making it easier to diagnose and fix issues, improve user experience, and ensure the smooth operation of your web application. Requestly provides session recording in its Chrome extension, using which users, testers, and developers can record web sessions to debug an issue faster and fix it quickly.
It helps you to share sessions from your machine with your developers or testers with video, network logs, console logs, environment details, etc., being part of the debug session. The recorded sessions can be viewed in any browser, even without the extension. To record a session, follow these steps:
- Go to https://app.requestly.io/sessions in the browser.
- You need to paste the URL of the website you want to record. I choose google.com
- Now, click start recording. It will open a new window tab.
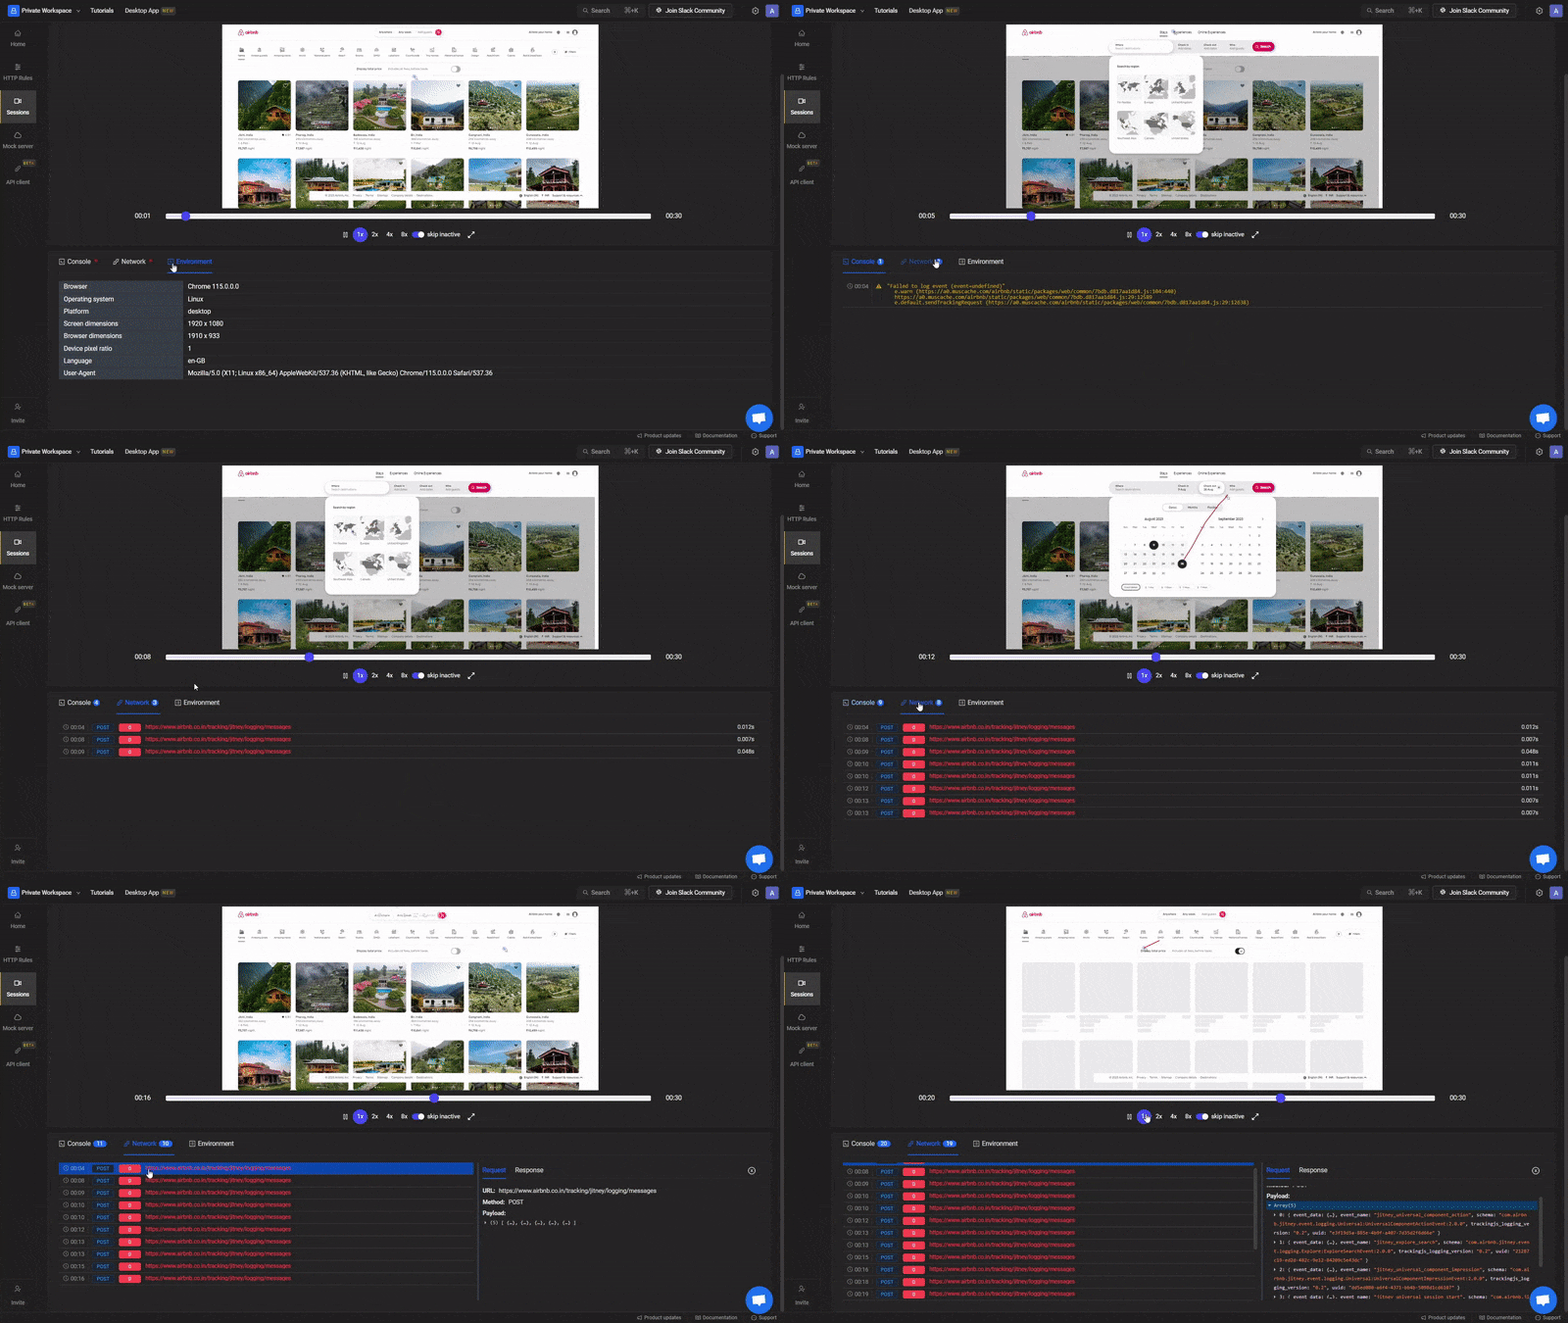
- Now, after finding any bug, just click on Stop & Watch recording. You will be redirected to a new window.
- You can find Console and Network logs and Environment details.
- Requestly provides playback features with 1x, 2x, 4x, and 8x speed and seek bar to seek. It also provides options to either save online or download.
Conclusion
Session recording helps in many ways, such as behaviour insights, user analytics, and bug reporting. It is very important to report a bug as that is a crucial aspect of using these tools. Requestly provides session recording in its Chrome extension, which you can save and share with developers with console and network logs, environment details, and a playback option.
Contents
Subscribe for latest updates
Share this article
Related posts
Get started today
Requestly isn’t available for download on mobile or tablets.
To download it, please open this page on a desktop PC and enter your email to get the link.


- Local Projects
- Organize API into Collections & Environments
- API Tests
- Import from Postman, OpenAPI, etc


- Redirect URLs & modify HTTP headers
- Mock API / GraphQL responses
- Insert custom JavaScript scripts


