Monitor & Debug APIs with Chrome Request Interceptors

Your lightweight Client for API debugging
No Login Required
Requestly is a web proxy that requires a desktop and desktop browser.
Enter your email below to receive the download link. Give it a try next time you’re on your PC!


Introduction
Monitoring and debugging APIs are essential to ensure the reliability, robustness, and performance of an application. They help identify and resolve issues that could affect the user experience. In this blog, we’ll explore how to use Chrome Request Interceptors to Monitor and Debug APIs
Setting Up Chrome Developer Tools
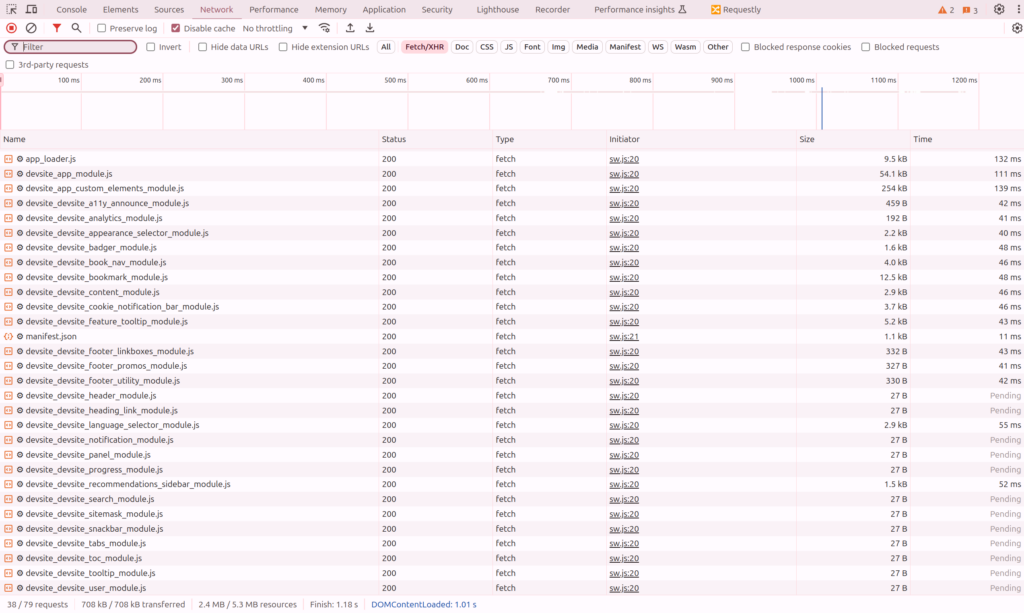
Before we dive into intercepting requests, let’s get familiar with Chrome Developer Tools. You can open Developer Tools by pressing F12 or Ctrl+Shift+I (Windows/Linux) or Cmd+Opt+I (Mac). Navigate to the Network tab, where you can capture and analyze network requests and responses.
Understanding Chrome Request Interceptors
Request interceptors are tools or extensions that allow you to intercept, modify, and monitor HTTP requests and responses. They are invaluable for debugging issues, simulating different scenarios, and ensuring that your APIs are functioning as expected.
Here are some popular tools you can use to intercept requests in Chrome:
Using Chrome Developer Tools for API Monitoring.
- Capturing Network Requests:
- Open Chrome Developer Tools by pressing
F12orCtrl+Shift+I(Windows/Linux) orCmd+Opt+I(Mac). - Navigate to the Network tab.
- Filter requests by type (XHR, Fetch) to focus on API calls.
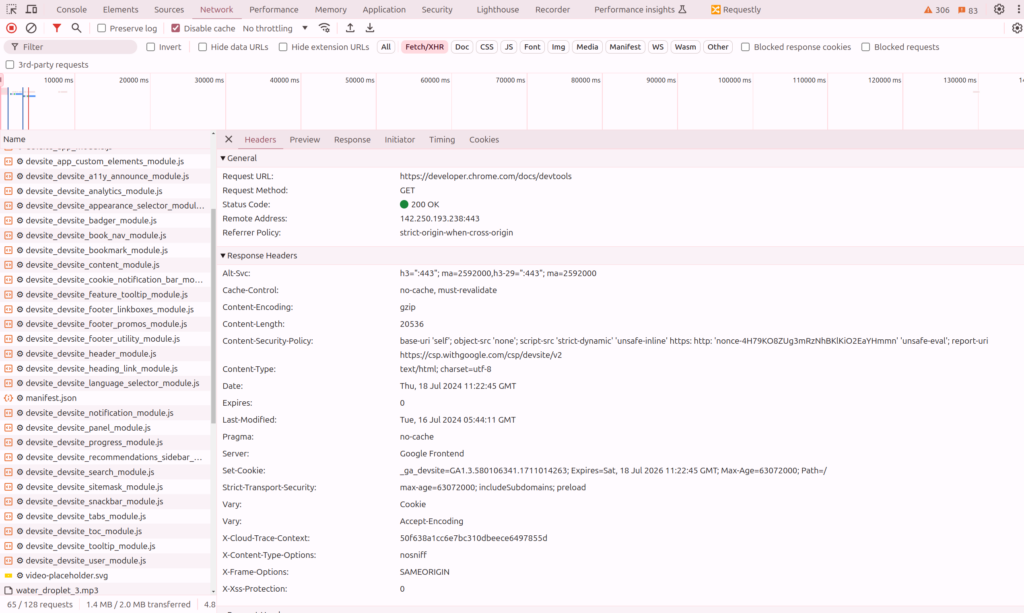
- Analyze request headers and payload to understand what data is being sent to the server.
- Open Chrome Developer Tools by pressing
- Analyzing Error Responses:
- Identify error codes (4xx, 5xx) in the response headers.
- Check the error messages in the response body to understand the cause of the failure.
- Cross-reference error responses with the corresponding requests to pinpoint issues
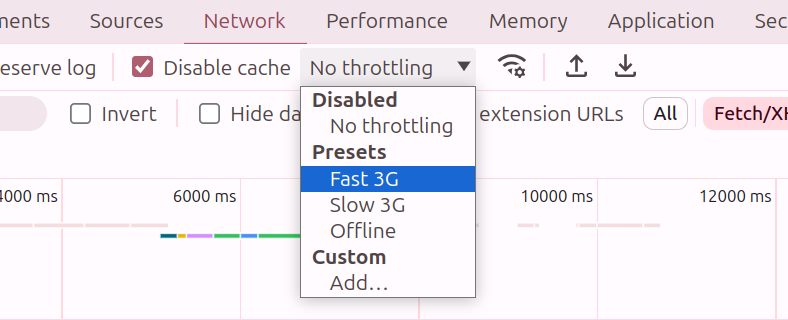
Throttling Network Speed:
- Simulate different network conditions using the Throttling feature in the Network tab.
- Test how your application behaves under various bandwidth constraints (e.g., slow 3G, fast 3G).
- Identify performance issues that arise under slower network conditions.
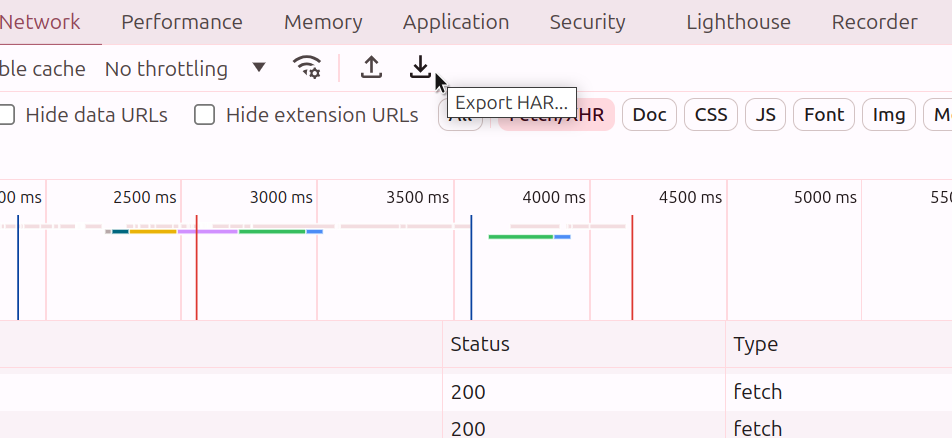
- Saving and Exporting Network Data:
- Save captured network activity as a HAR (HTTP Archive) file for later analysis.
- Export specific requests and responses for sharing with team members or for use in automated tests.
Debugging APIs with Requestly
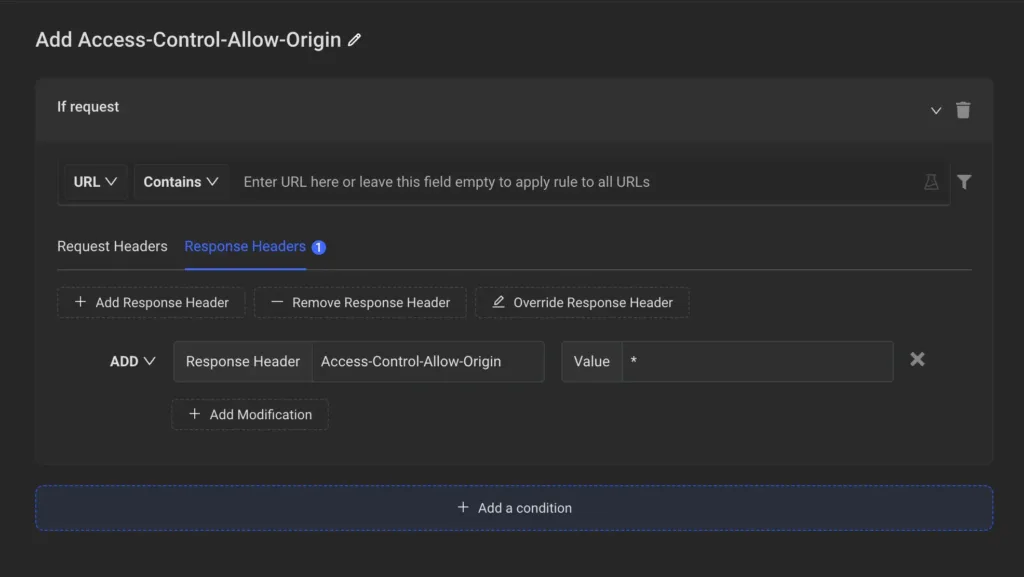
Setting Up Requestly:
- Install Requestly from the Chrome Web Store.
- Open the Requestly app to start .
- Create rules in the Requestly app to modify request parameters and headers
Modifying Requests and Responses:
- Customize requests by modifying parameters, headers, or payloads to simulate various scenarios (e.g., changing data inputs, adding delays).
- Modify request methods to ensure API endpoints handle different types of requests correctly (e.g., switching from GET to POST).
- Modify response status codes or payloads to simulate error scenarios (e.g., 404 Not Found, 500 Internal Server Error) and validate error handling mechanisms.
Testing Authentication
- Modify authentication tokens or headers in Requestly to test scenarios such as token expiration, token revocation, or invalid token responses.
- Validate API responses against different user roles to ensure proper access controls are enforced for sensitive resources.
Collaboration and Teamwork
- Share Requestly Rule via links for collaboration and replicate debugging environments across team members.
- Use Requestly’s team workspace feature to manage and update debugging rules and configurations within collaborative projects.
Conclusion
Monitoring and debugging APIs with Requestly can significantly enhance the reliability and performance of your web applications. By understanding and utilizing this tool, you can effectively troubleshoot issues, and ensure a seamless user experience.
References
Contents
Subscribe for latest updates
Share this article
Related posts
Get started today
Requestly is a web proxy that requires a desktop and desktop browser.
Enter your email below to receive the download link. Give it a try next time you’re on your PC!


