How to Test Product Changes Without Deploying to Production

Your lightweight Client for API debugging
No Login Required
Requestly isn’t available for download on mobile or tablets.
To download it, please open this page on a desktop PC and enter your email to get the link.


- Local Projects
- Organize API into Collections & Environments
- API Tests
- Import from Postman, OpenAPI, etc


- Redirect URLs & modify HTTP headers
- Mock API / GraphQL responses
- Insert custom JavaScript scripts
Remote Debugging of Javascript using Requestly
Ever wished that you could know how your changes worked in production without actually “deploying to production”?
Being able to edit remote code can be a huge time saver and I hope this article will help you see why. Using tools like Requestly, you can follow your debugging routine (add console logs and use breakpoints) even on sites where you do not have the source code!
Setting everything up
First, we will identify the request for our remote resource. You can use the chrome network tab for this. Search for the javascript or CSS file that you wish to debug. Click on the request log and copy the request URL, this will come in handy later.

I have a debug version of the script served locally using a python server. The whole idea of remote debugging is to swap out the remote file with the local file. I have the launch script for adobe target that I found on t-mobile.com and I have also unminified it for convenience.
Now we will need to serve this file from a local server. You can easily do this with python or node. With python you can run the following command.
python3 -m http.server <port> –bind 127.0.0.1
Now that we have the url of the resource that we want to debug and an endpoint that serves our local copy of that resource, all we have to do is redirect the request on the production site from the original endpoint to the local endpoint.
If you haven’t already, download the Requestly chrome extension and create a Redirect rule from the create rule button on the dashboard
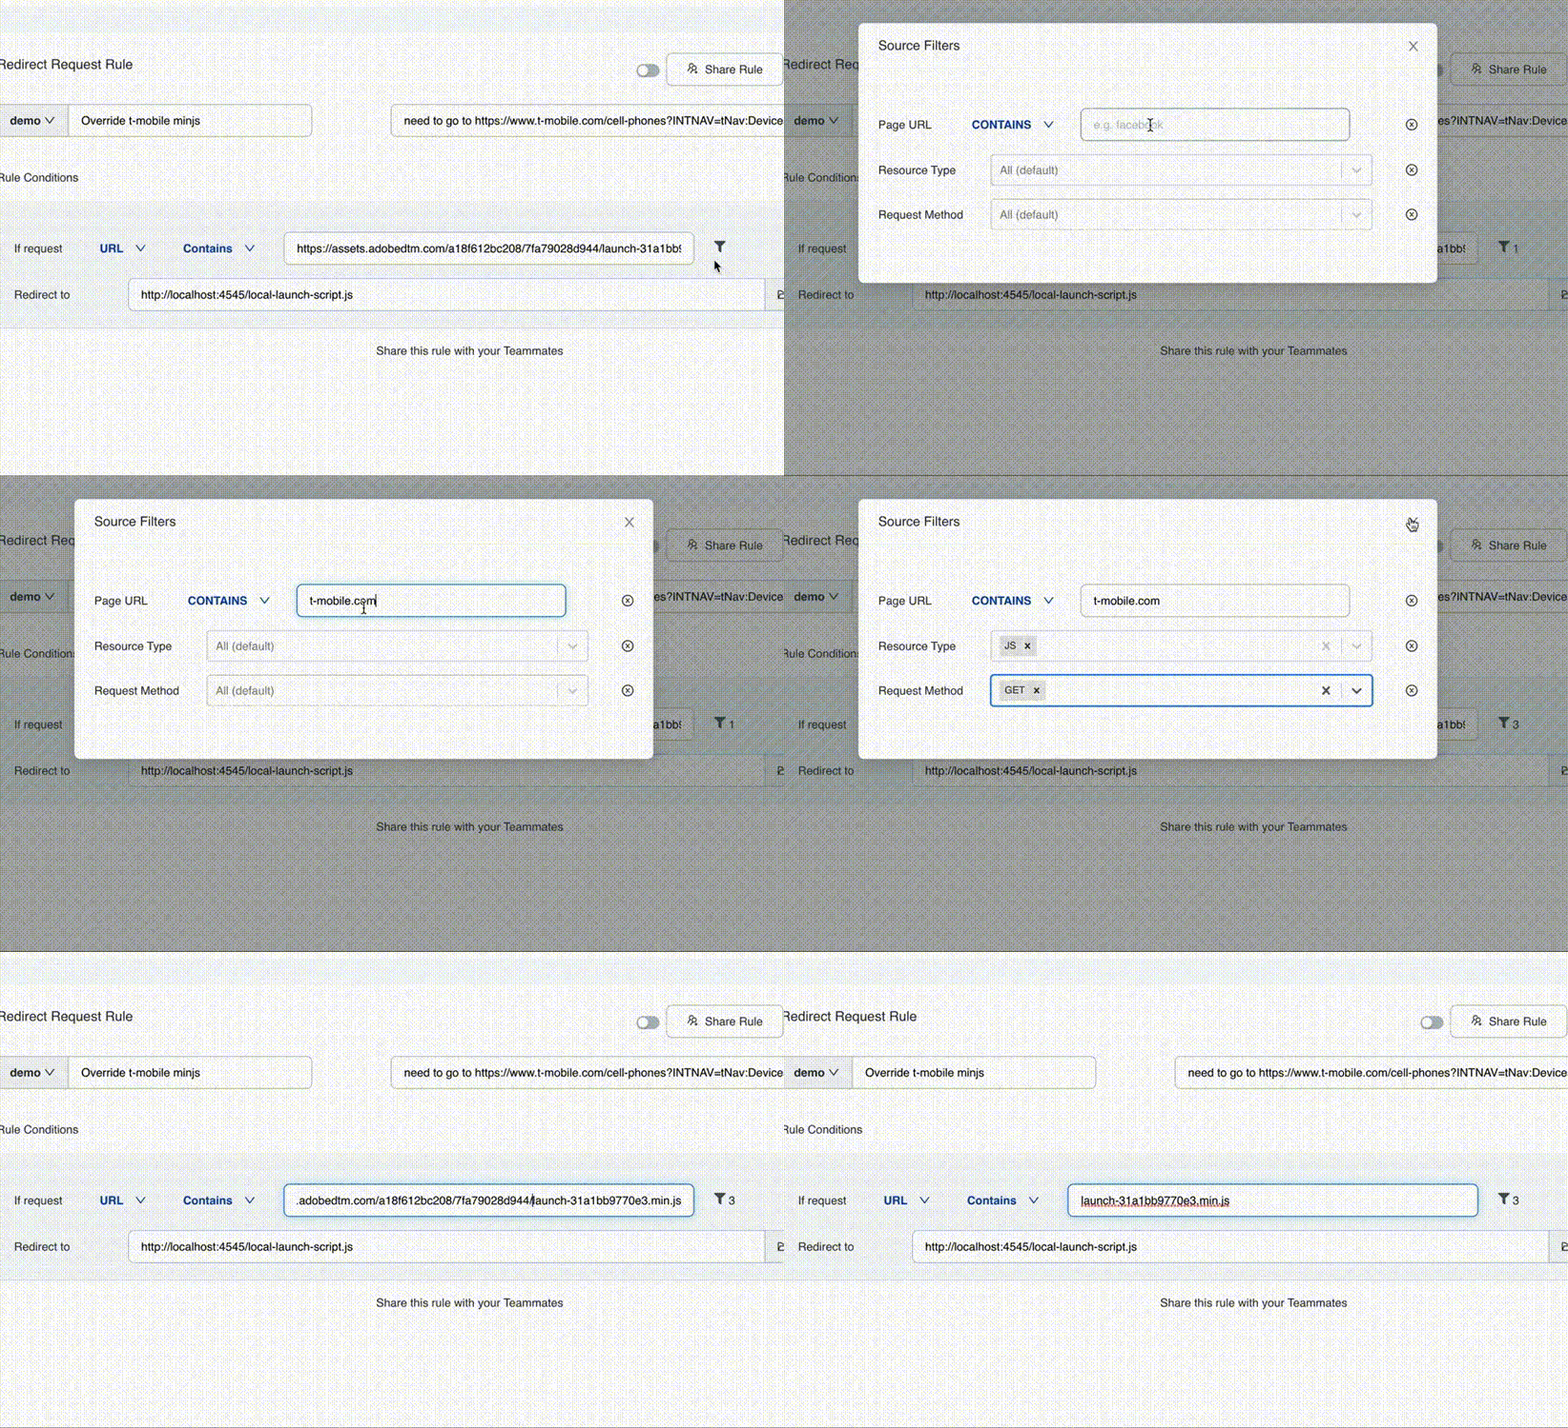
This just requires a simple redirect rule in Requestly. Click on Create New Rule on the top right and select the Redirect Rule
In the source url, paste the original url (one that you previously copied) and in the destination enter the path to local file served from the python server.

Give your rule a name, and click save.
You can also apply advanced filters like host name matching or filtering based on resource type or request type by clicking on the small funnel icon. If you do it right, you will only need to specify the name of the file in the source field.

Start debugging.
Now in the network tab, if you look for the same request it should look something like this

This shows that the rule worked and now you are being served your local version of that file. But just be sure before you start debugging your site with this file, let us add a simple console log.

Now refresh the page and check the console. You will also notice the Requestly extension icon change colour whenever a rule is being applied

Conclusion
Now you can use all the chrome debugger tools like breakpoints and stack traces to debug this file.
In case you still feel confused on how to debug remotely with Requestly, here’s a video that will help you see these steps in action
Requestly does a lot more than just redirect routes. You can modify headers, modify responses and even inject scripts.
If you found this useful, here are 5 more ways you can use Requestly to debug your web apps – https://requestly.com/blog/5-ways-to-make-debugging-easy/
Happy Debugging
Contents
Subscribe for latest updates
Share this article
Related posts
Get started today
Requestly isn’t available for download on mobile or tablets.
To download it, please open this page on a desktop PC and enter your email to get the link.


- Local Projects
- Organize API into Collections & Environments
- API Tests
- Import from Postman, OpenAPI, etc


- Redirect URLs & modify HTTP headers
- Mock API / GraphQL responses
- Insert custom JavaScript scripts


