How to Inspect Network Traffic on Mac
Your lightweight Client for API debugging
No Login Required
Requestly works on desktop.
Enter your email below to get the download link and try it when you’re on your PC.


Introduction
Network requests are vital in communicating between clients and servers in web and software development. Monitoring network traffic on mac is of paramount importance for several reasons. Firstly, it enables developers to identify and resolve issues that may arise during communication. By analyzing the requests, developers can uncover errors, missing data, or server-side problems, facilitating effective debugging.
Inspecting network requests is crucial for several reasons:
Debugging
Network requests can contain valuable information about errors or issues that may occur during the communication between a client and a server. By inspecting these requests, developers can identify and diagnose problems, such as incorrect parameters, missing data, or server-side errors. It helps in understanding the root cause of issues and enables effective debugging. Raw requests/responses provide the most detailed and accurate representation of the data being exchanged between the client and the server. By viewing the raw format, developers can examine the headers, payloads, and other relevant information in its original form. This allows for a complete understanding of the data being sent and received.
Performance Optimization
Analysing network requests allows developers to identify bottlenecks and optimise the performance of their applications. By inspecting the requests, they can determine if there are unnecessary or redundant requests, slow-loading assets, or excessive data transfers. This information helps in optimising network usage, reducing latency, and improving the overall performance of the application.
Security
Network requests can provide insights into potential security vulnerabilities in an application. By inspecting the requests, developers can check for secure communication protocols, validate data sent over the network, and identify any unauthorised access attempts or suspicious activities. This helps in strengthening the security measures of the application and mitigating potential risks. Viewing raw requests/responses is crucial for security analysis. It allows developers to scrutinise the exchanged data for any sensitive information that may be unintentionally exposed.
Understanding APIs & Services
Inspecting network requests provides developers with valuable insights into how APIs and services work. By examining the requests and responses, they can understand the underlying protocols, data formats, and authentication mechanisms used. This knowledge is crucial when developing applications that rely on external services or when building custom integrations.
Protocol Compliance
Different protocols, such as HTTP, may have specific requirements or constraints. By inspecting raw requests/responses, developers can ensure that their applications are compliant with these protocols. They can verify headers, status codes, content types, and other elements to guarantee adherence to the defined standards.
Different Sources From Where You Can Inspect Traffic
There are various sources from where you can inspect network traffic, each serving different purposes and providing valuable insights into the data flowing through your network. Here are some common sources from which you can inspect traffic:
- Web Browsers: Modern web browsers come equipped with developer tools that allow you to inspect network traffic when loading web pages. The “Network” tab in browsers like Google Chrome, Mozilla Firefox, Brave and Microsoft Edge provides detailed information about HTTP requests and responses, including headers, status codes, and payload data.
- Mobile Apps: For mobile app developers and security professionals, tools like Charles Proxy, mitmproxy, Wireshark and Requestly can be used to intercept and inspect network traffic generated by mobile applications. By setting up these tools as proxies, you can analyze the HTTP/HTTPS requests and responses made by the app.
- Desktop Apps: Certain desktop applications, especially those used for web development or API testing, often have built-in features or plugins that allow you to inspect network traffic. For example, Postman, a popular API testing tool, has a built-in network request logger that displays detailed information about HTTP requests and responses.
- Terminal: Command-line tools like cURL and wget can be used to make HTTP requests from the terminal. By using appropriate flags or additional tools like tcpdump or Wireshark, you can capture and inspect the network traffic generated by these commands.
- Backend Processes: When developing backend applications using frameworks like Node.js, Python, or any other programming language, you can incorporate logging or debugging mechanisms to inspect the network traffic. By logging the incoming requests and outgoing responses, you can analyze the data being processed by the backend.
Monitor Network Traffic on Mac Using Terminal
You can inspect network traffic using terminal by following:
- Open Terminal: Go to Applications > Utilities > Terminal to open the Terminal application.
- Check available network interfaces: Before capturing network traffic, you need to identify the network interface you want to monitor. To see the list of available network interfaces, run the following command: <mark>ifconfigLook</mark> for the network interface you want to monitor (e.g., en0 for Wi-Fi, en1 for Ethernet).
- Capture network traffic: Once you know the network interface, use the tcpdump command with sudo (requires administrator privileges) to capture the network traffic. Replace “en0” with your desired network interface: <mark>sudo tcpdump -i en0</mark>. By default, tcpdump will capture and display all network traffic on the specified interface. To stop the capture, press “Ctrl + C.”
- Filter network traffic (optional): If you want to capture specific types of traffic, you can apply filters to tcpdump. For example, to capture only HTTP traffic, you can use the following filter: <mark>sudo tcpdump -i en0 port 80</mark>
- Save the captured data (optional): If you want to save the captured network traffic to a file for later analysis, you can redirect the output to a file using the “>” operator. For example: <mark>sudo tcpdump -i en0 > network_traffic.pcap </mark>
This is how it looks like
Inspect Network Traffic Using Chrome Dev Tools on Mac
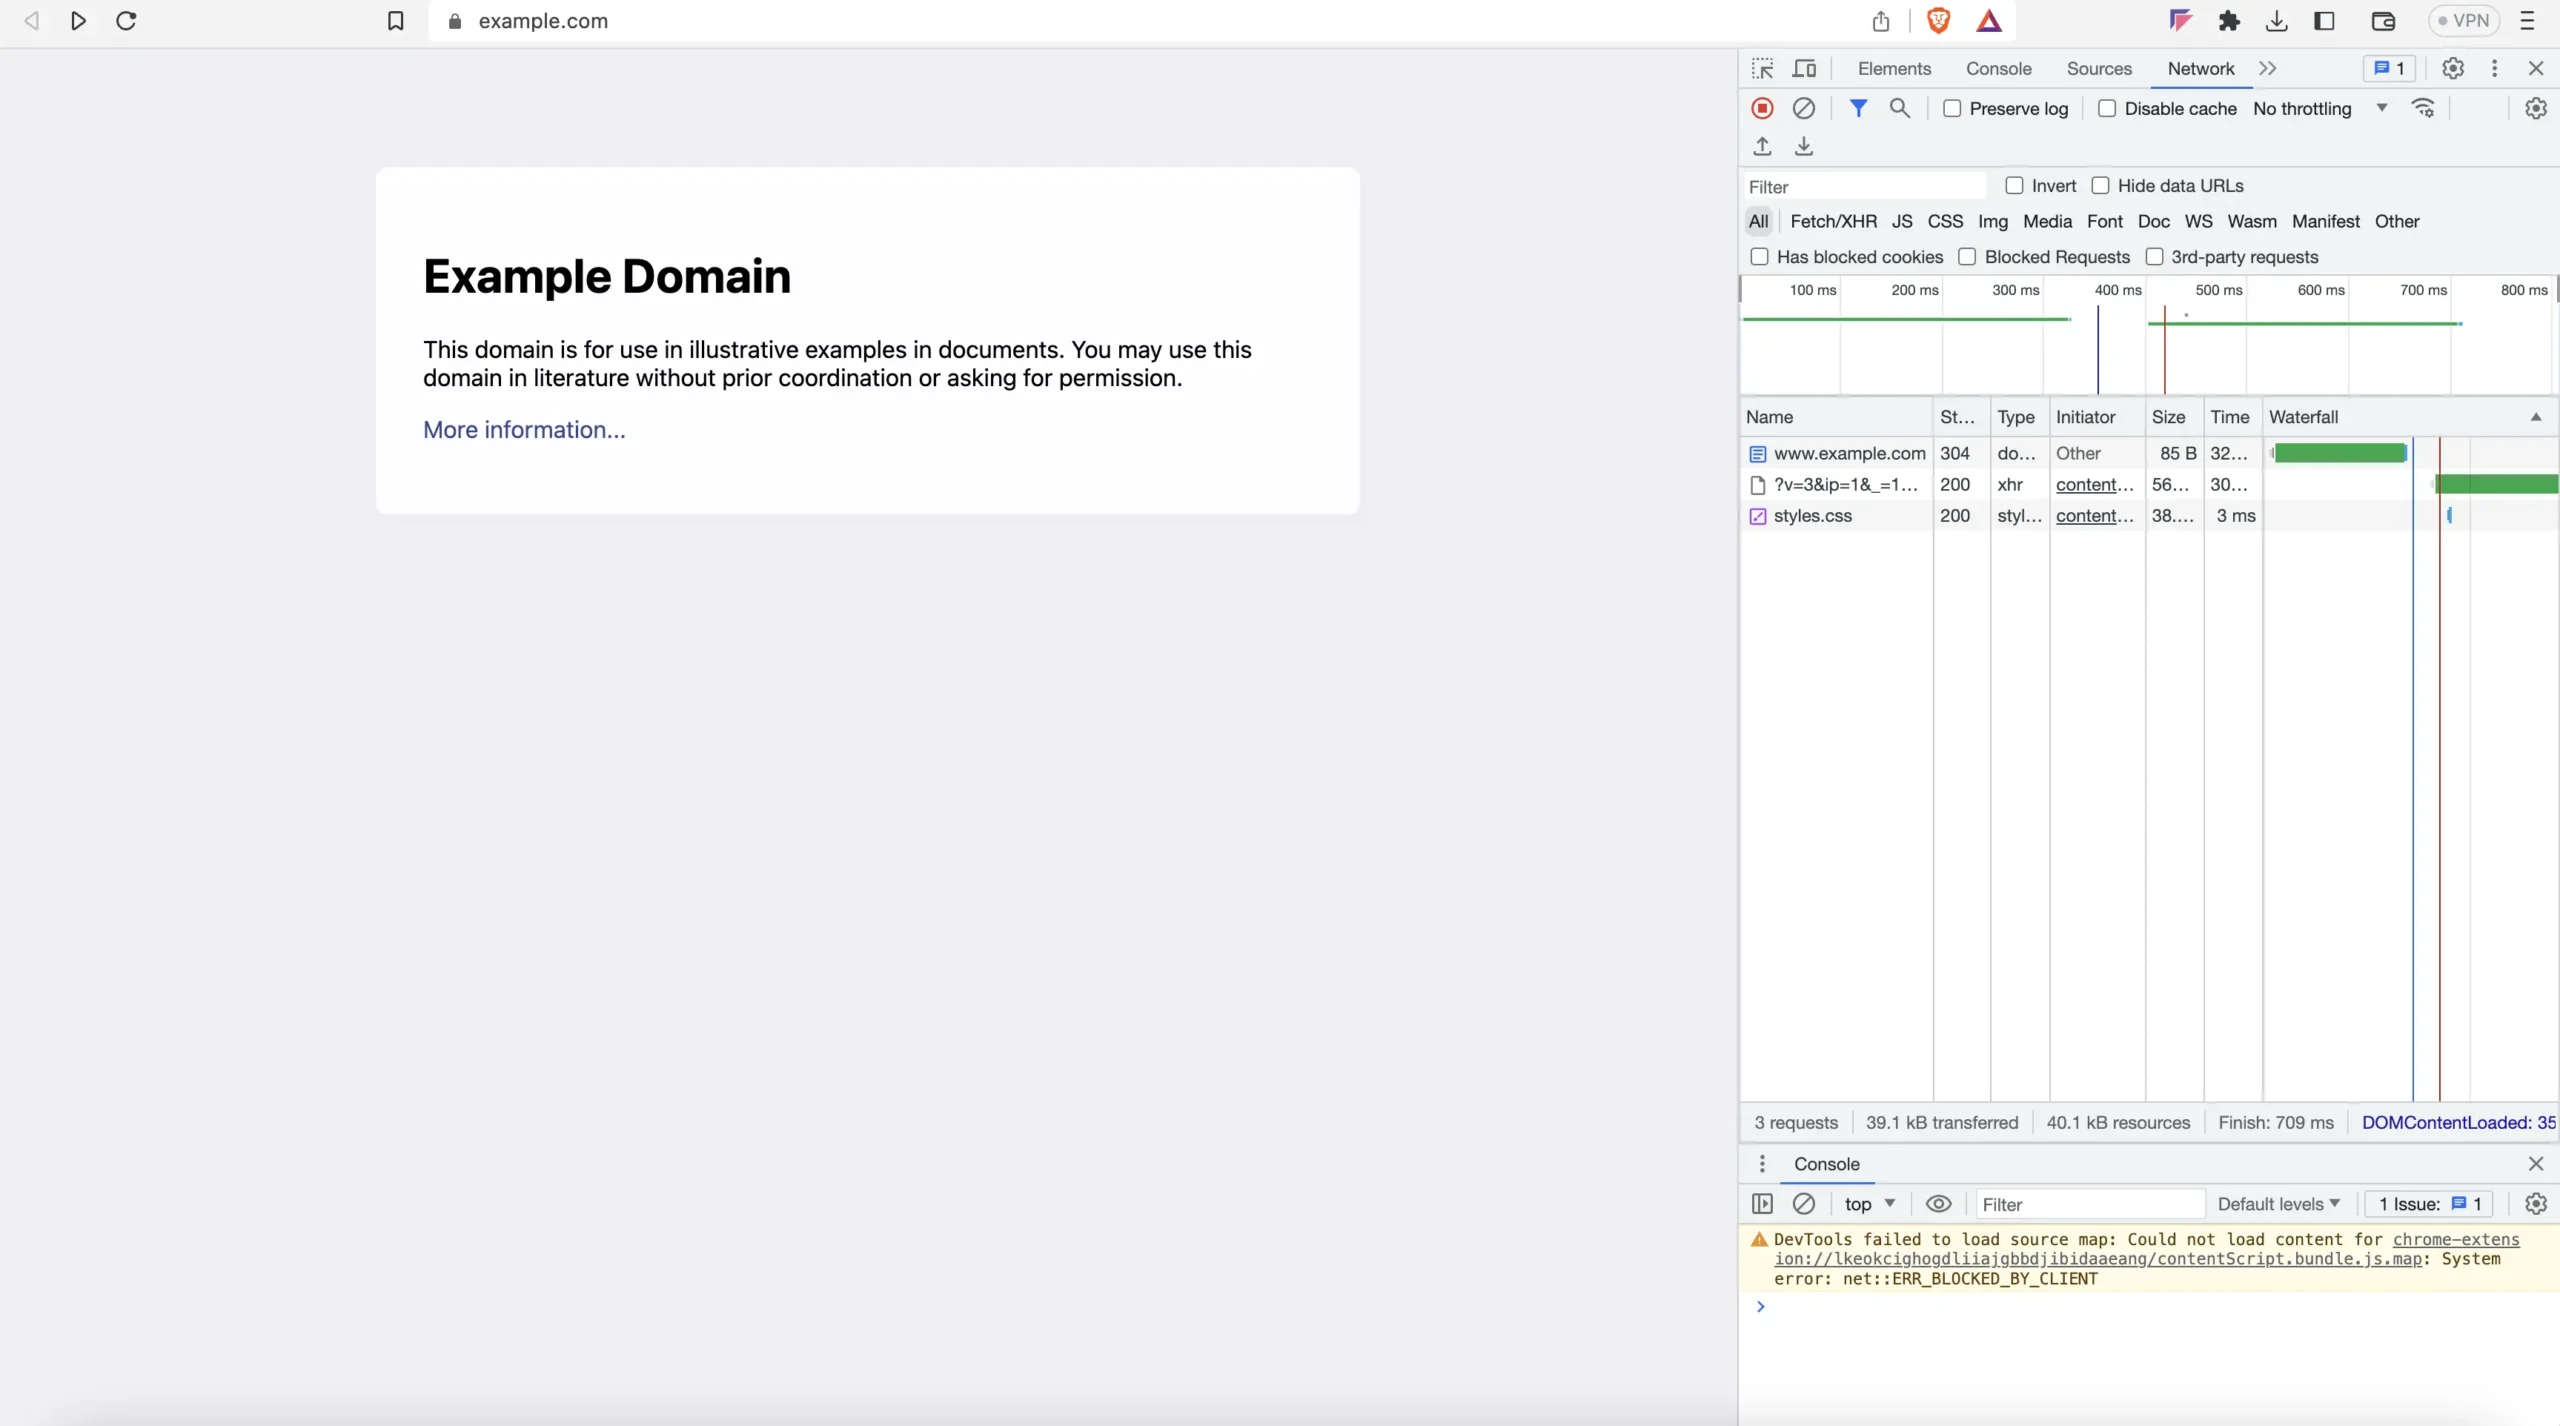
Now, the easiest way to inspect network traffic is to use Browser Dev Tools.
- Open Google Chrome and navigate to the website you want to inspect.
- Right-click anywhere on the page and select “Inspect” from the context menu. Alternatively, you can press Command+Option+I on mac to open the DevTools.
- In the DevTools panel, navigate to the “Network” tab. This tab displays all the network requests made by the page.
- Refresh the page to capture the network requests made during the page load.
- You can now explore the network requests in the Network tab. You can see details such as the request URL, HTTP method, status code, headers, payload, response data, and timing information.
- Click on a specific network request to view more details about it, including request and response headers, preview of response data, and timing information.
- As for a live example website to test network traffic inspection, I’m using our own website: https://www.requestly.io
- You can also filter the network requests by various criteria. For example, you can filter requests by file type (e.g., images, JavaScript, CSS), by specific URLs, or by status codes. Use the filter bar or right-click on a request and choose “Filter” options to apply filters.

Inspecting Browser Network Traffic using Requestly Desktop App on Mac
To inspect network traffic using the Requestly desktop app, you can follow these steps:
1. Download and install the Requestly desktop app from the official website.
2. Launch the Requestly app on your mac.
3. In the app’s main interface, You will get a pop up to Connect App.
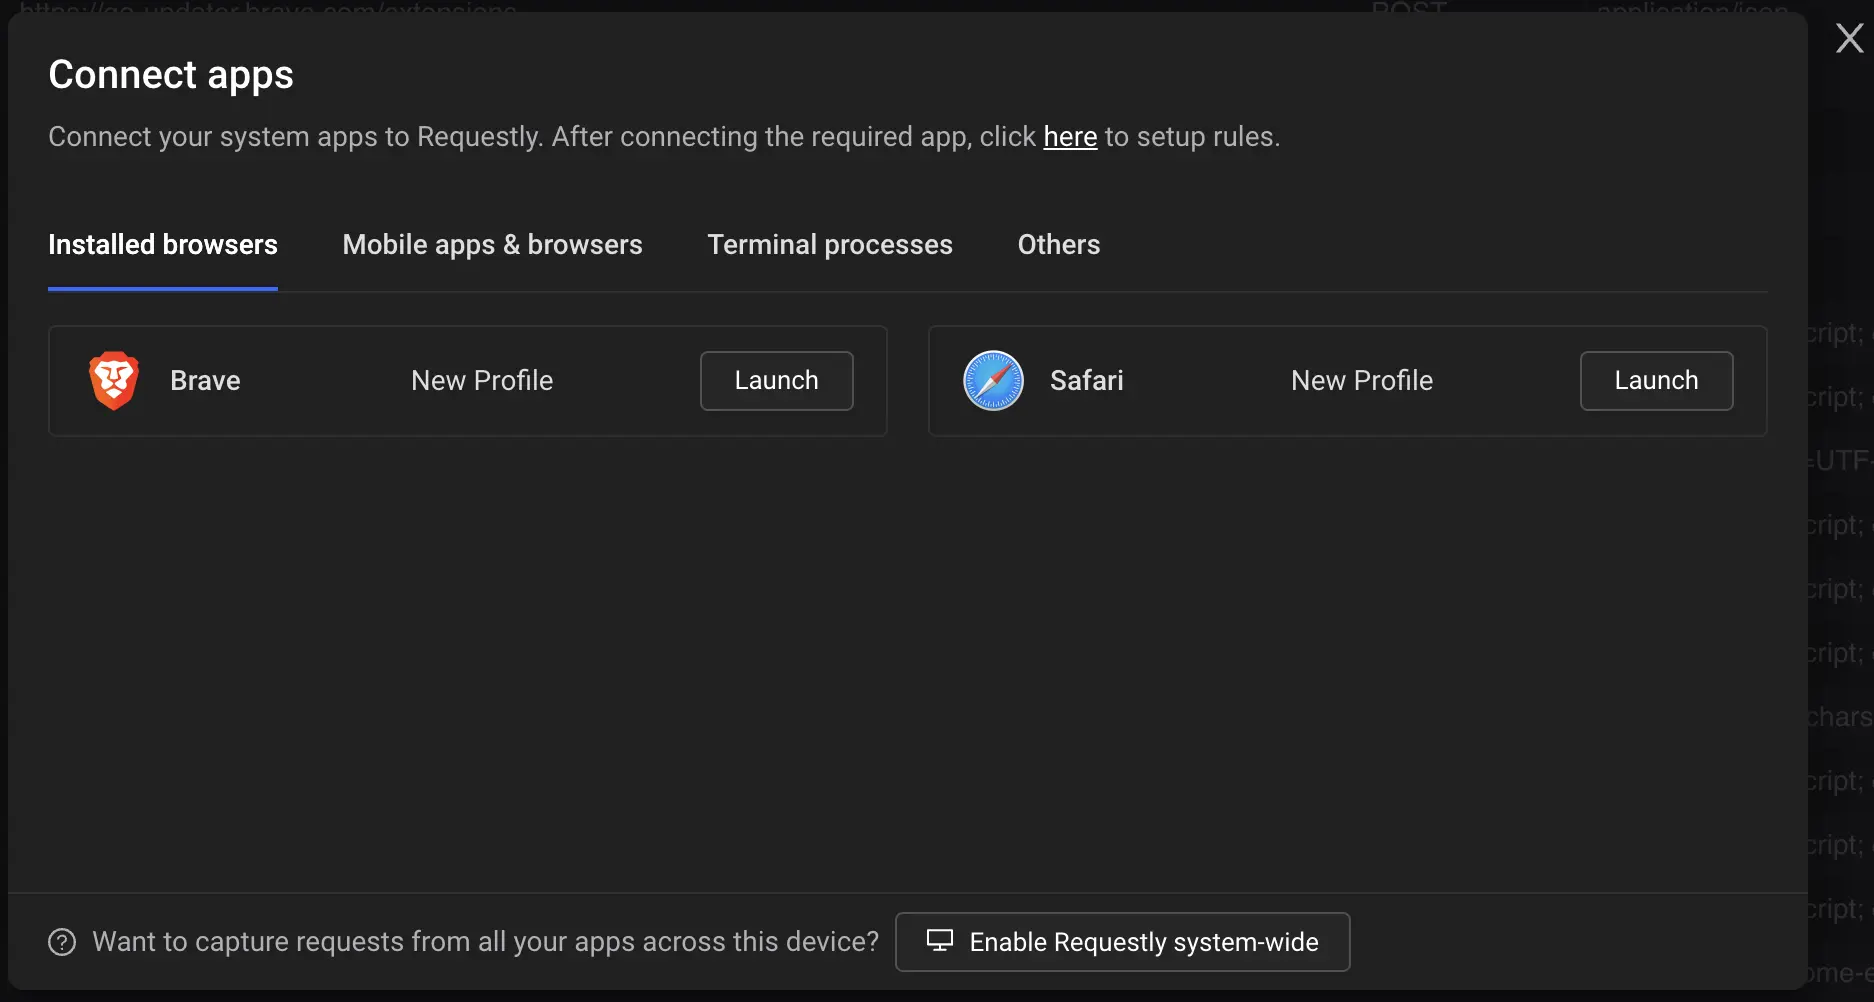
4. Now, click on Launch button for this example we will use Brave or you can click on Enable Requestly system-wide to capture network traffic from all apps.
5. Once you click on Launch. Brave will browser will open up.
6. Now, lets search for google.com on brave and now check Requestly desktop app.
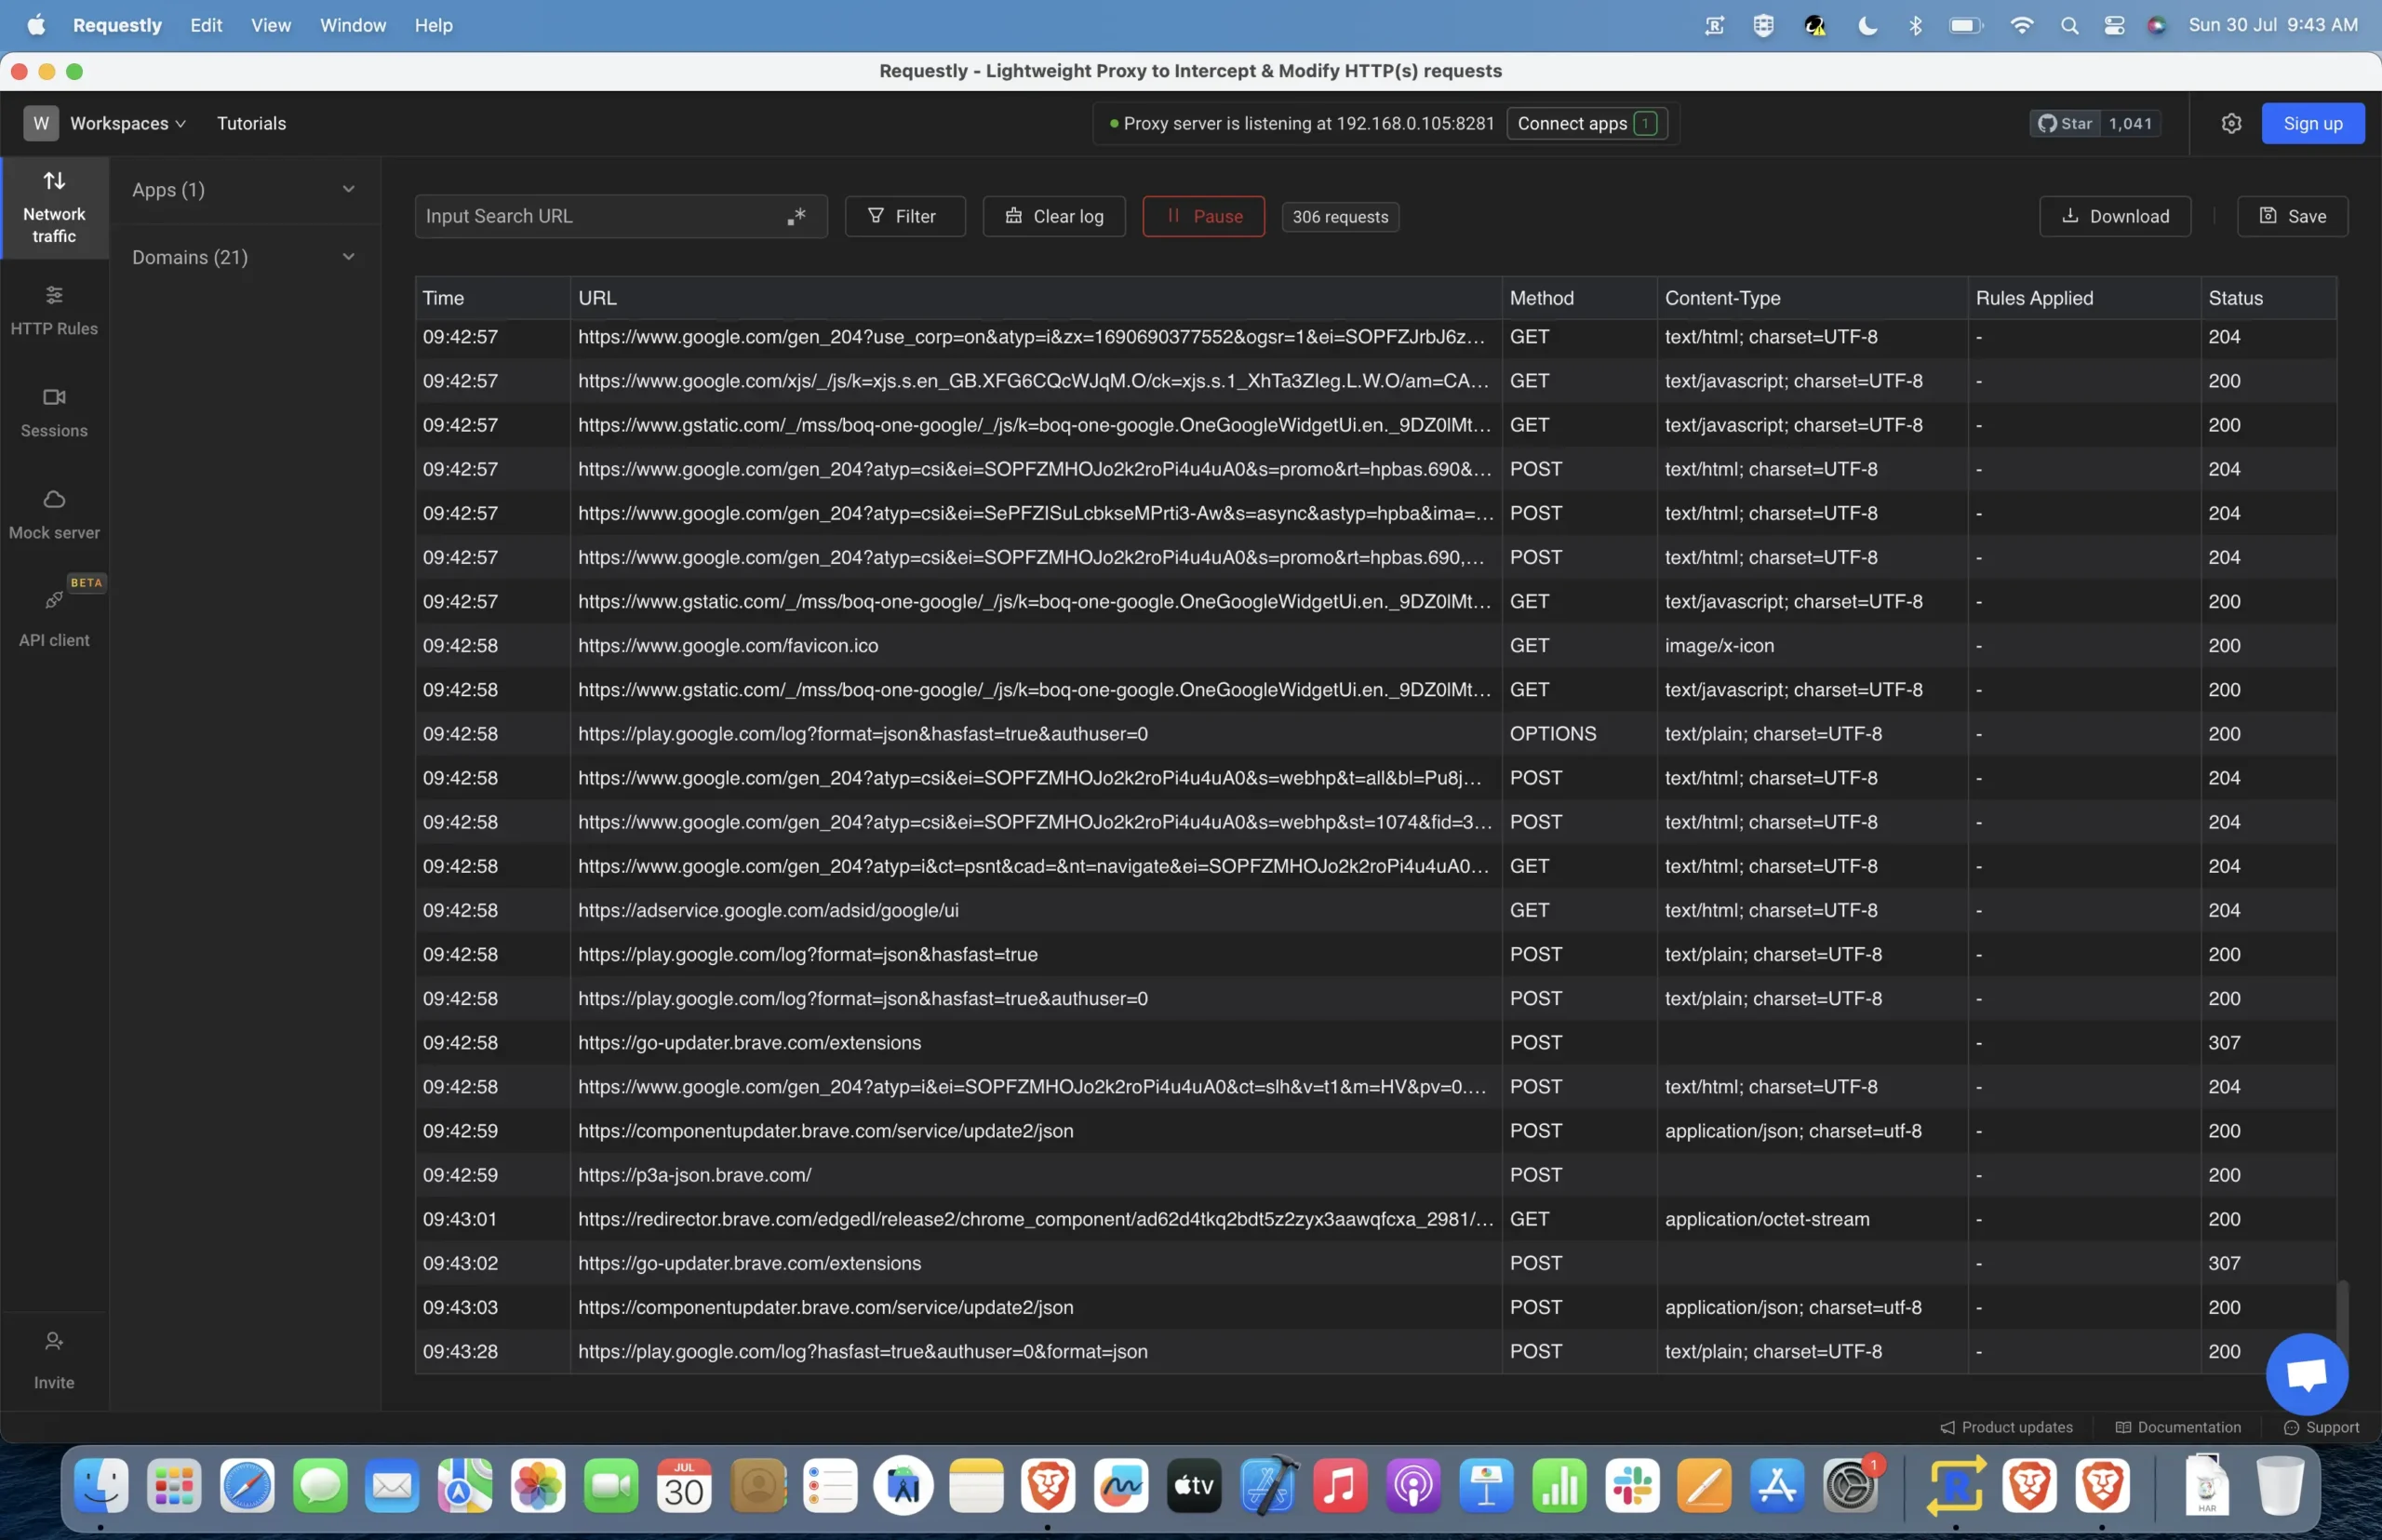
You will be able to monitor network traffic on Requestly.
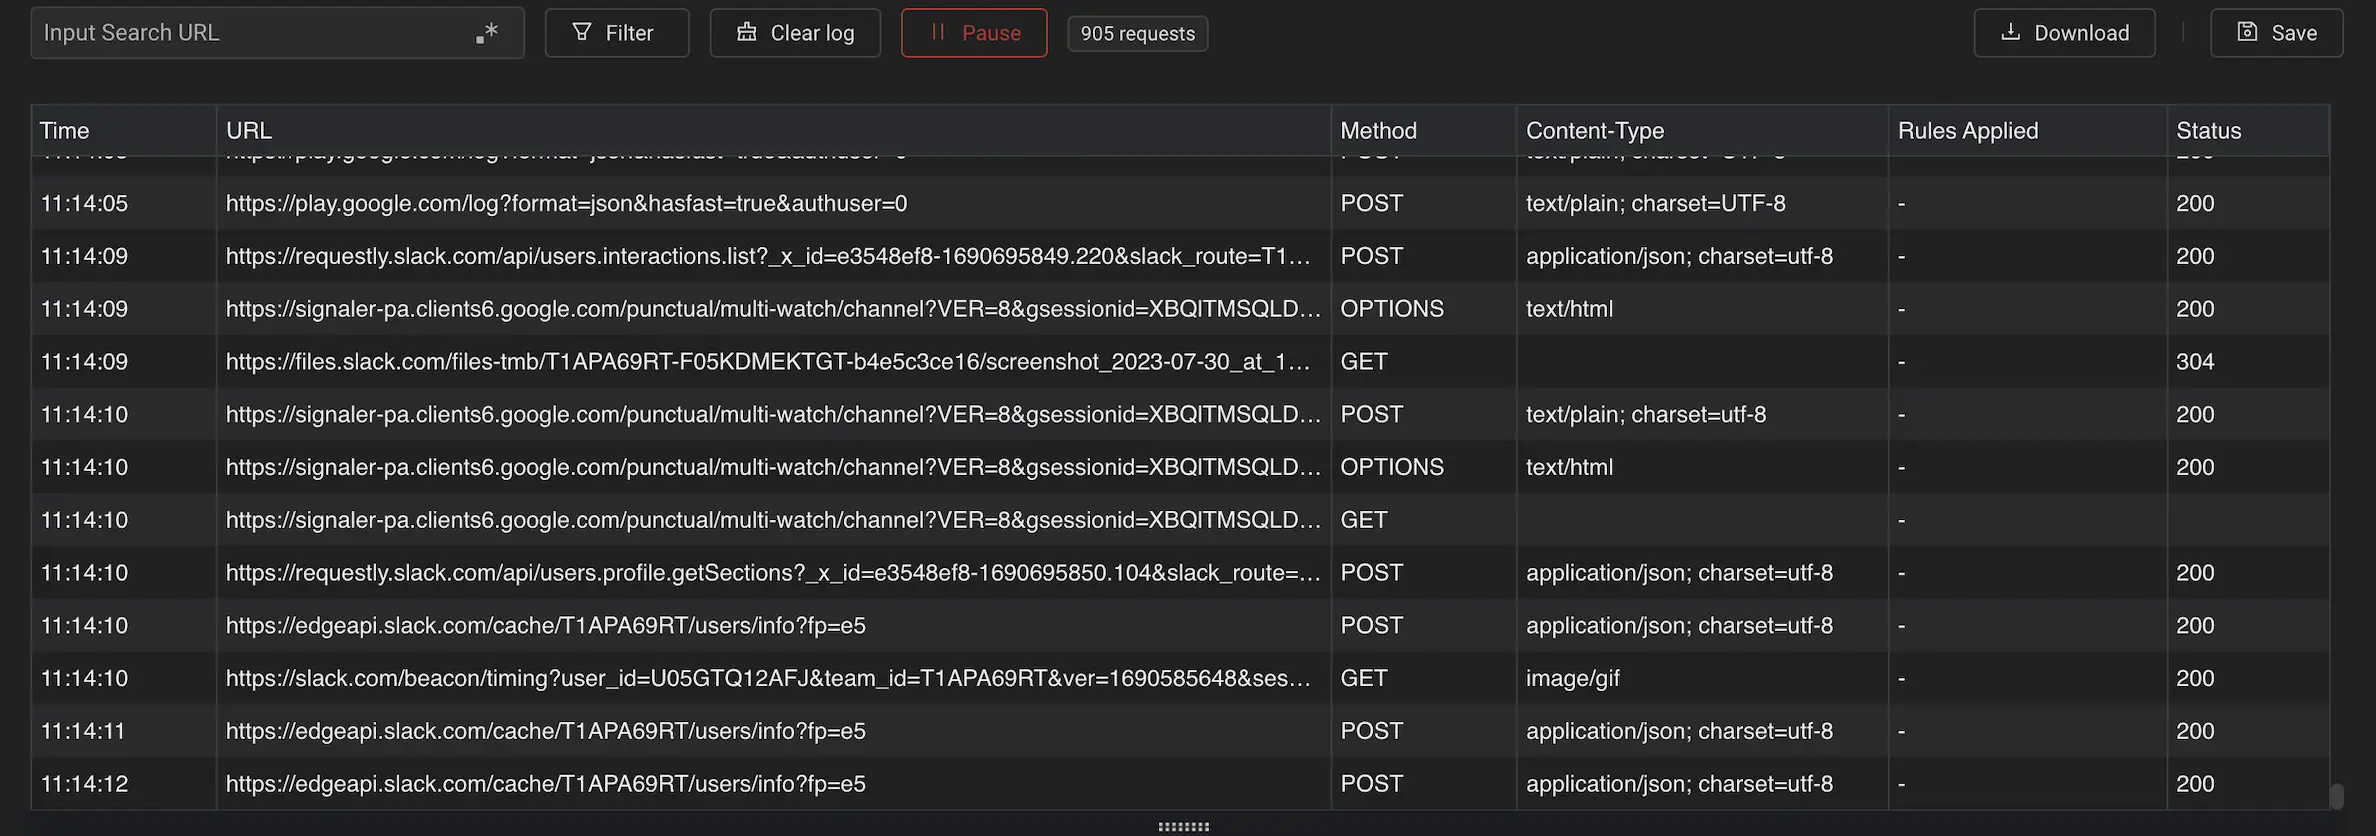
7. If you want to monitor network traffic of all apps click on Enable Requestly system-wide. Now lets monitor Slack network traffic.
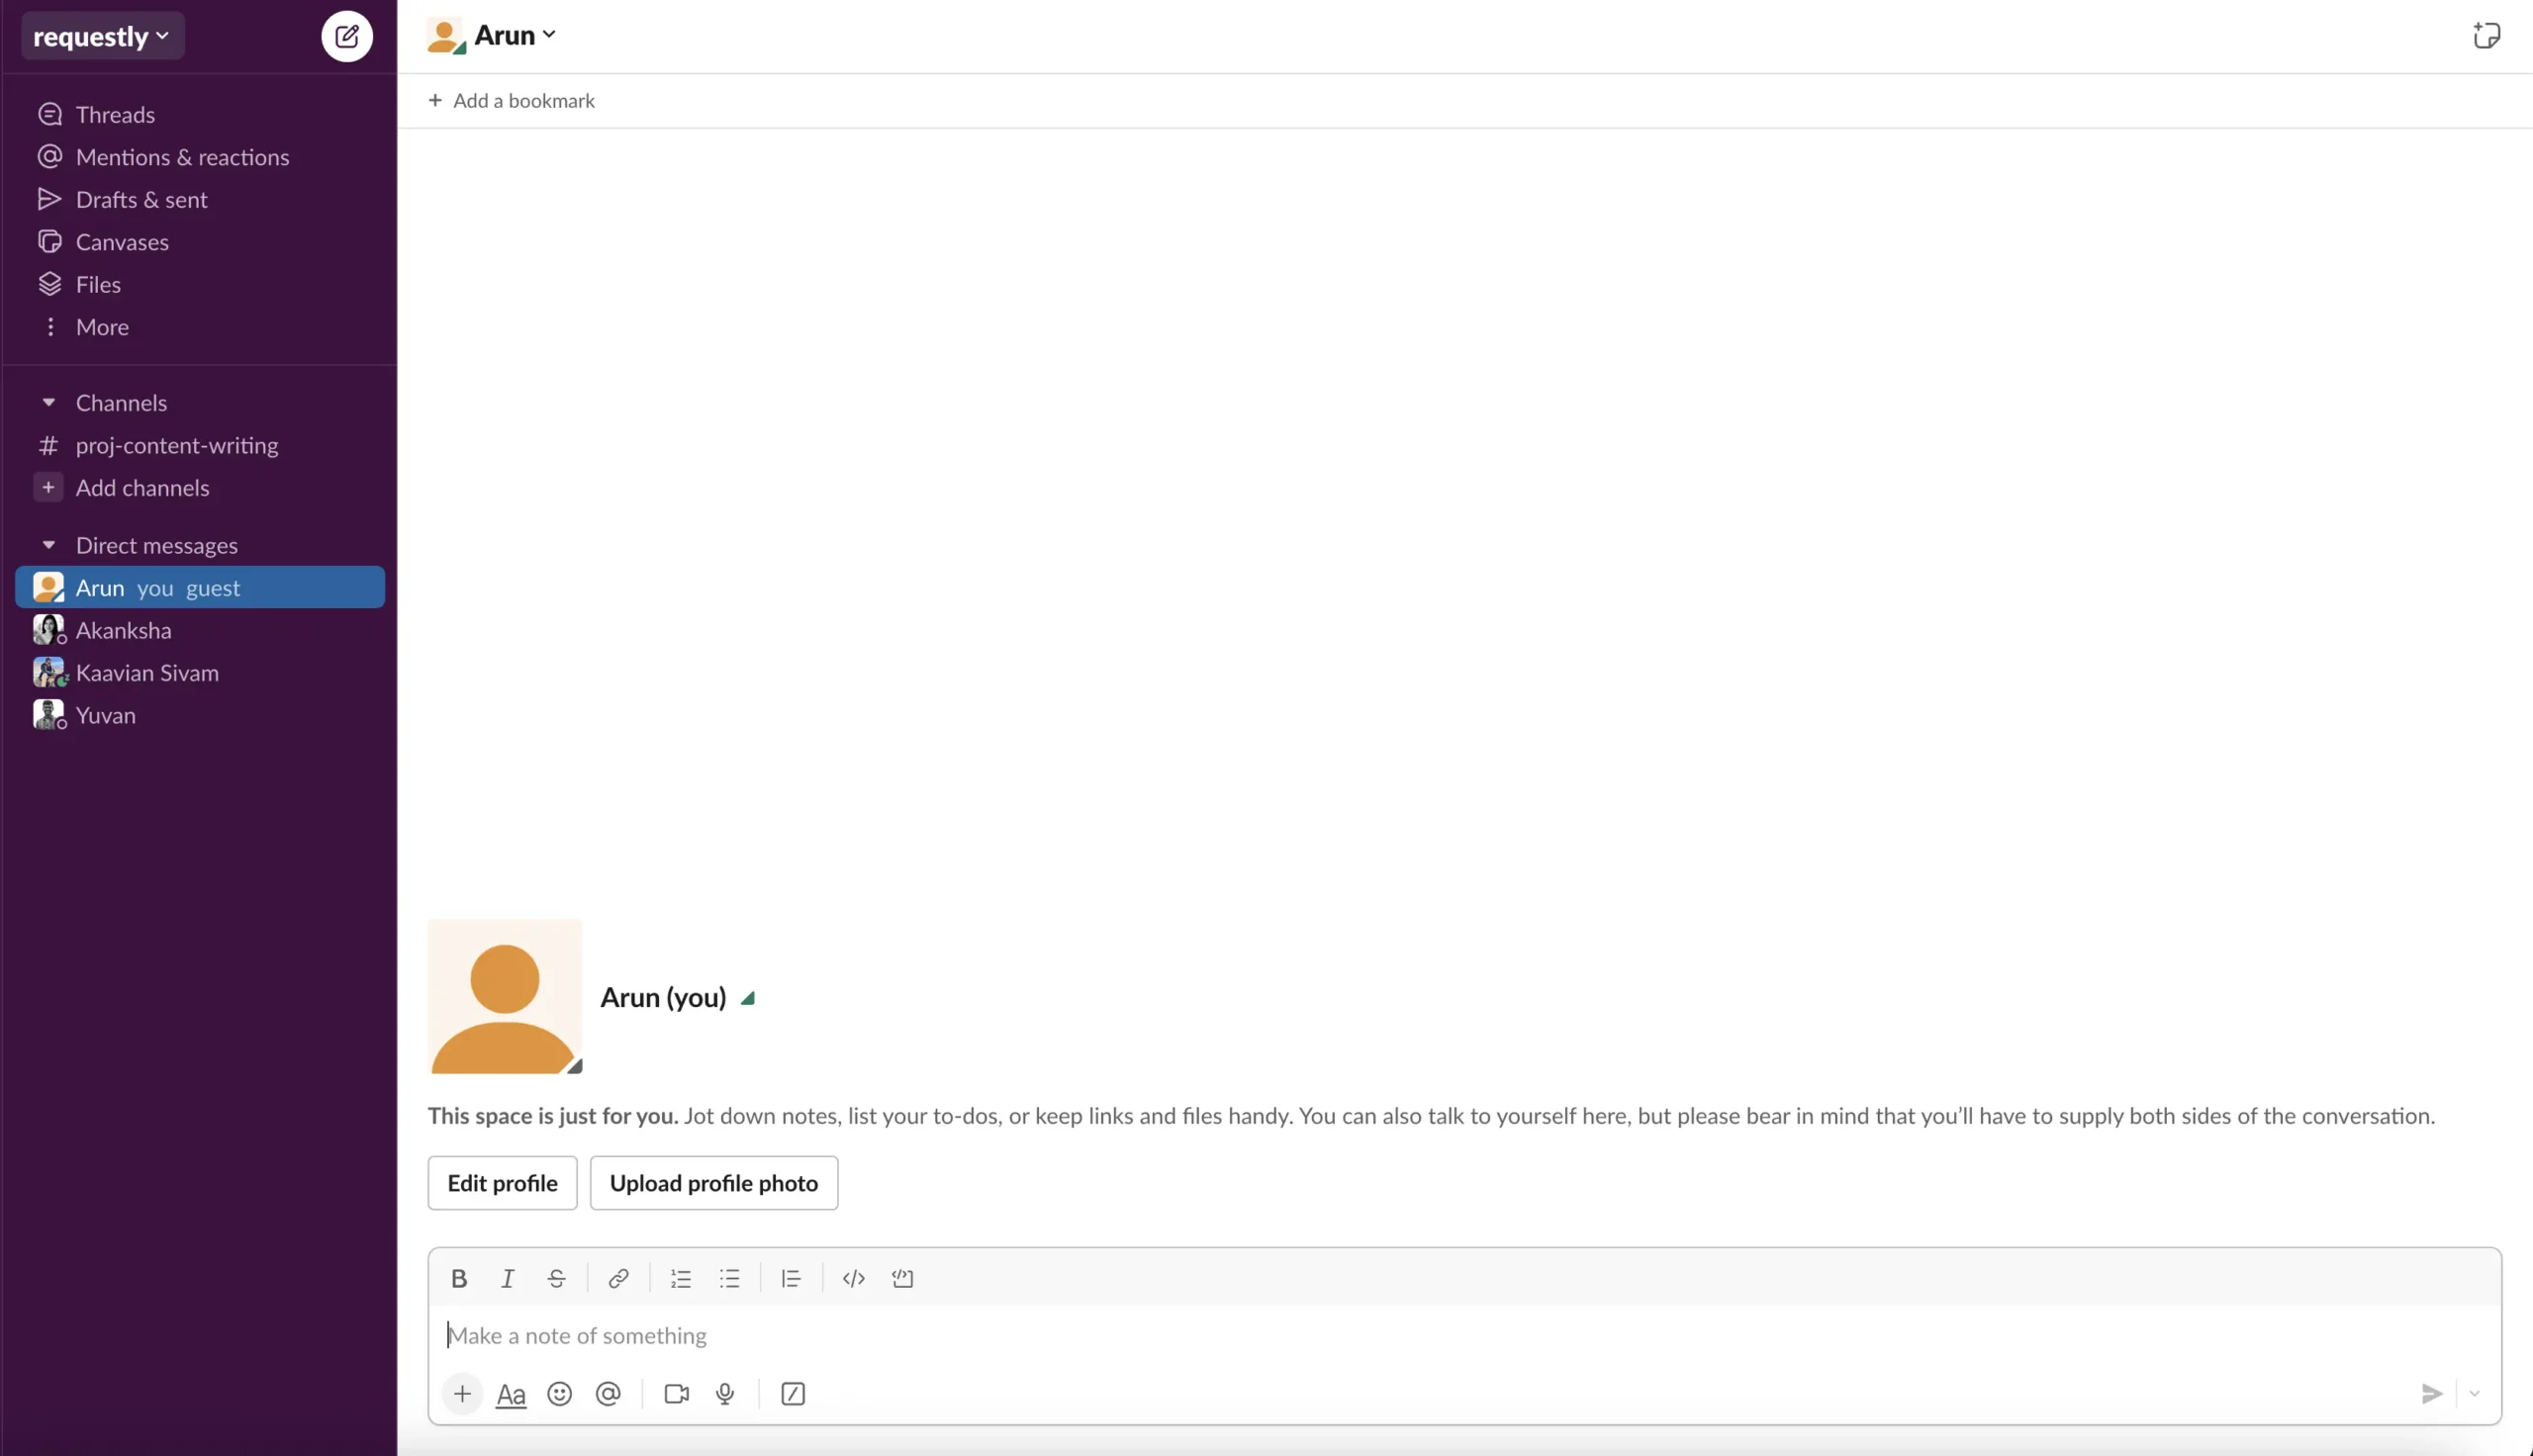
8. If you now open Requestly Desktop App you will see Slack Traffic.
Inspecting Mobile Apps Network Traffic on Mac
We can inspect mobile network traffic as well using Requestly app.
Follow these steps so that you can inspect mobile apps Network Traffic:
- Navigate to: Settings > Wi-Fi > Select current Wi-Fi > Modify.
- In Advanced Options, Set this config
- Proxy: Manual Host: 192.168.0.105 Port: 8281
- Open Incognito window on browser in your Android/IOS device and got to http://amiusing.requestly.io.
- If proxy is applied, then the page should show SUCCESS otherwise it will show FAILURE.
- Open Incognito window on browser http://requestly.io/ssl this will download RQProxyCA.pem.cert for Android and RQProxyCA.pem for IOS.
- Now go to Settings -> Security -> Encryption & Credentials -> Install a Certificate -> CA Certificate and Press Install Anyway and Select the certificate (RQProxyCA.pem.cert) in Android and for IOS Open settings. You should see a new Profile Downloaded option at the top. Select that to configure the profile and Press Install on the top right a few times and then click Done and then Settings -> General -> About -> Certificate Trust Settings and Toggle the switch for RQProxyCA under Enable Full Trust for Root Certificates.
- Then Click on Intercept Traffic button.
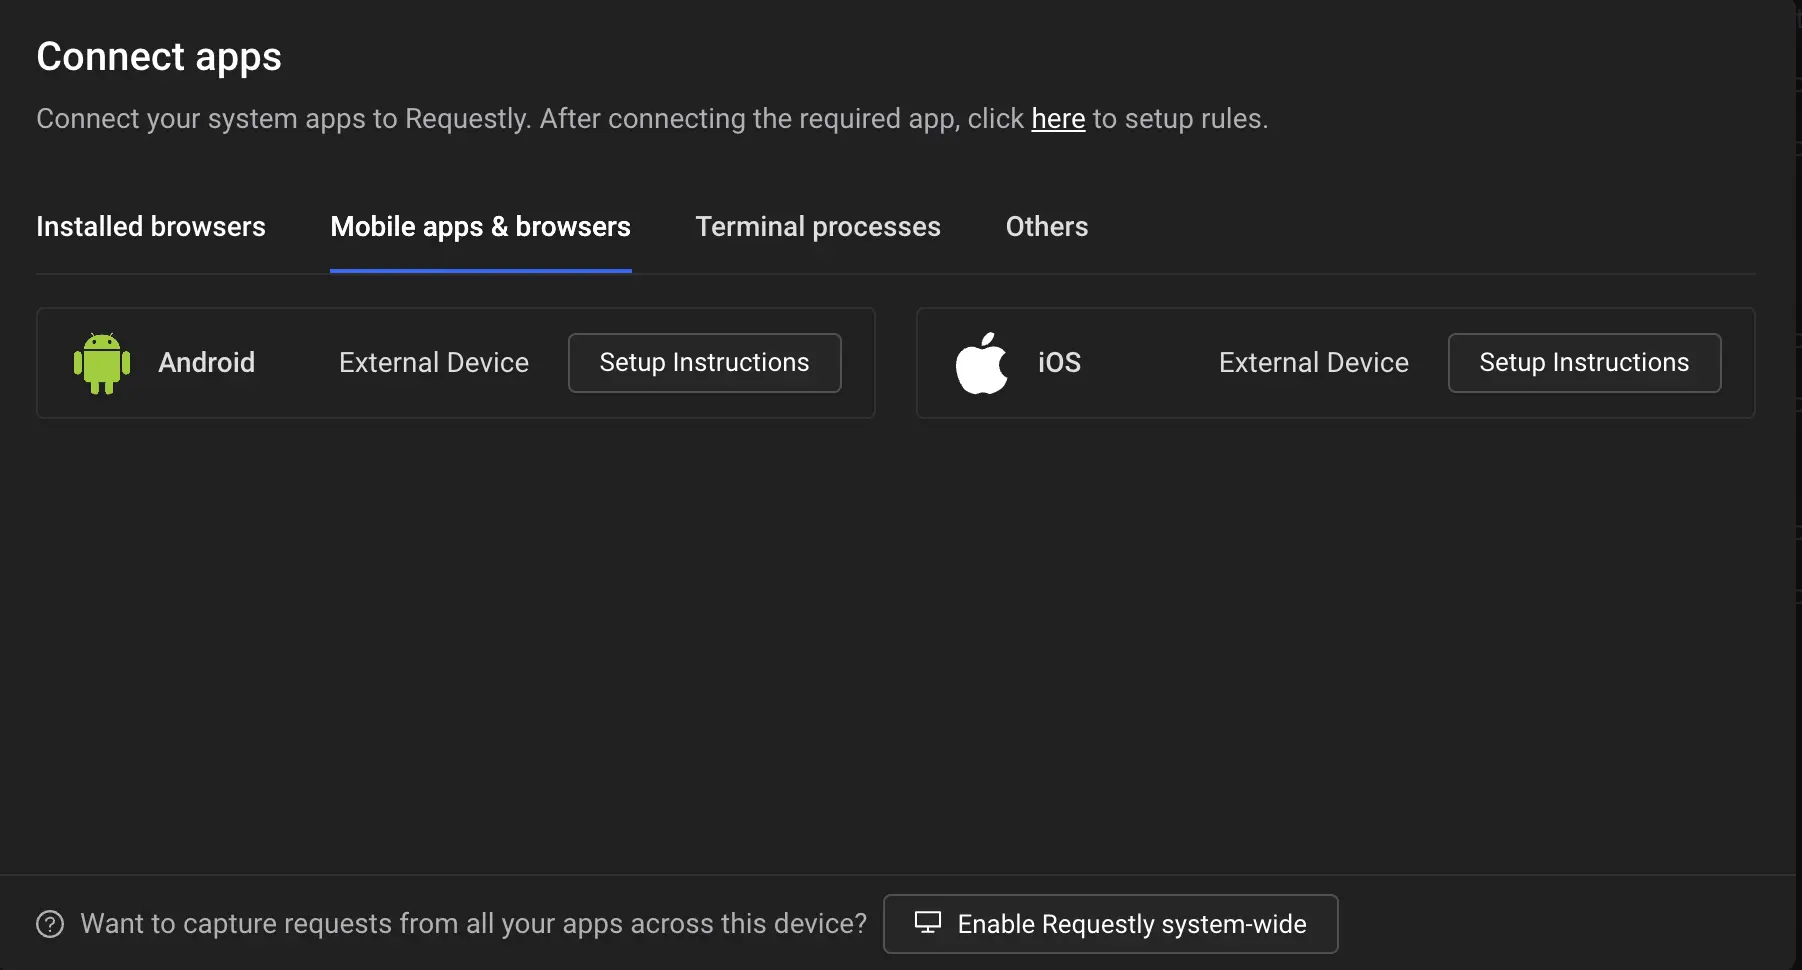
You can follow the steps mentioned here as well which will have instructions to monitor network in Android and IOS.
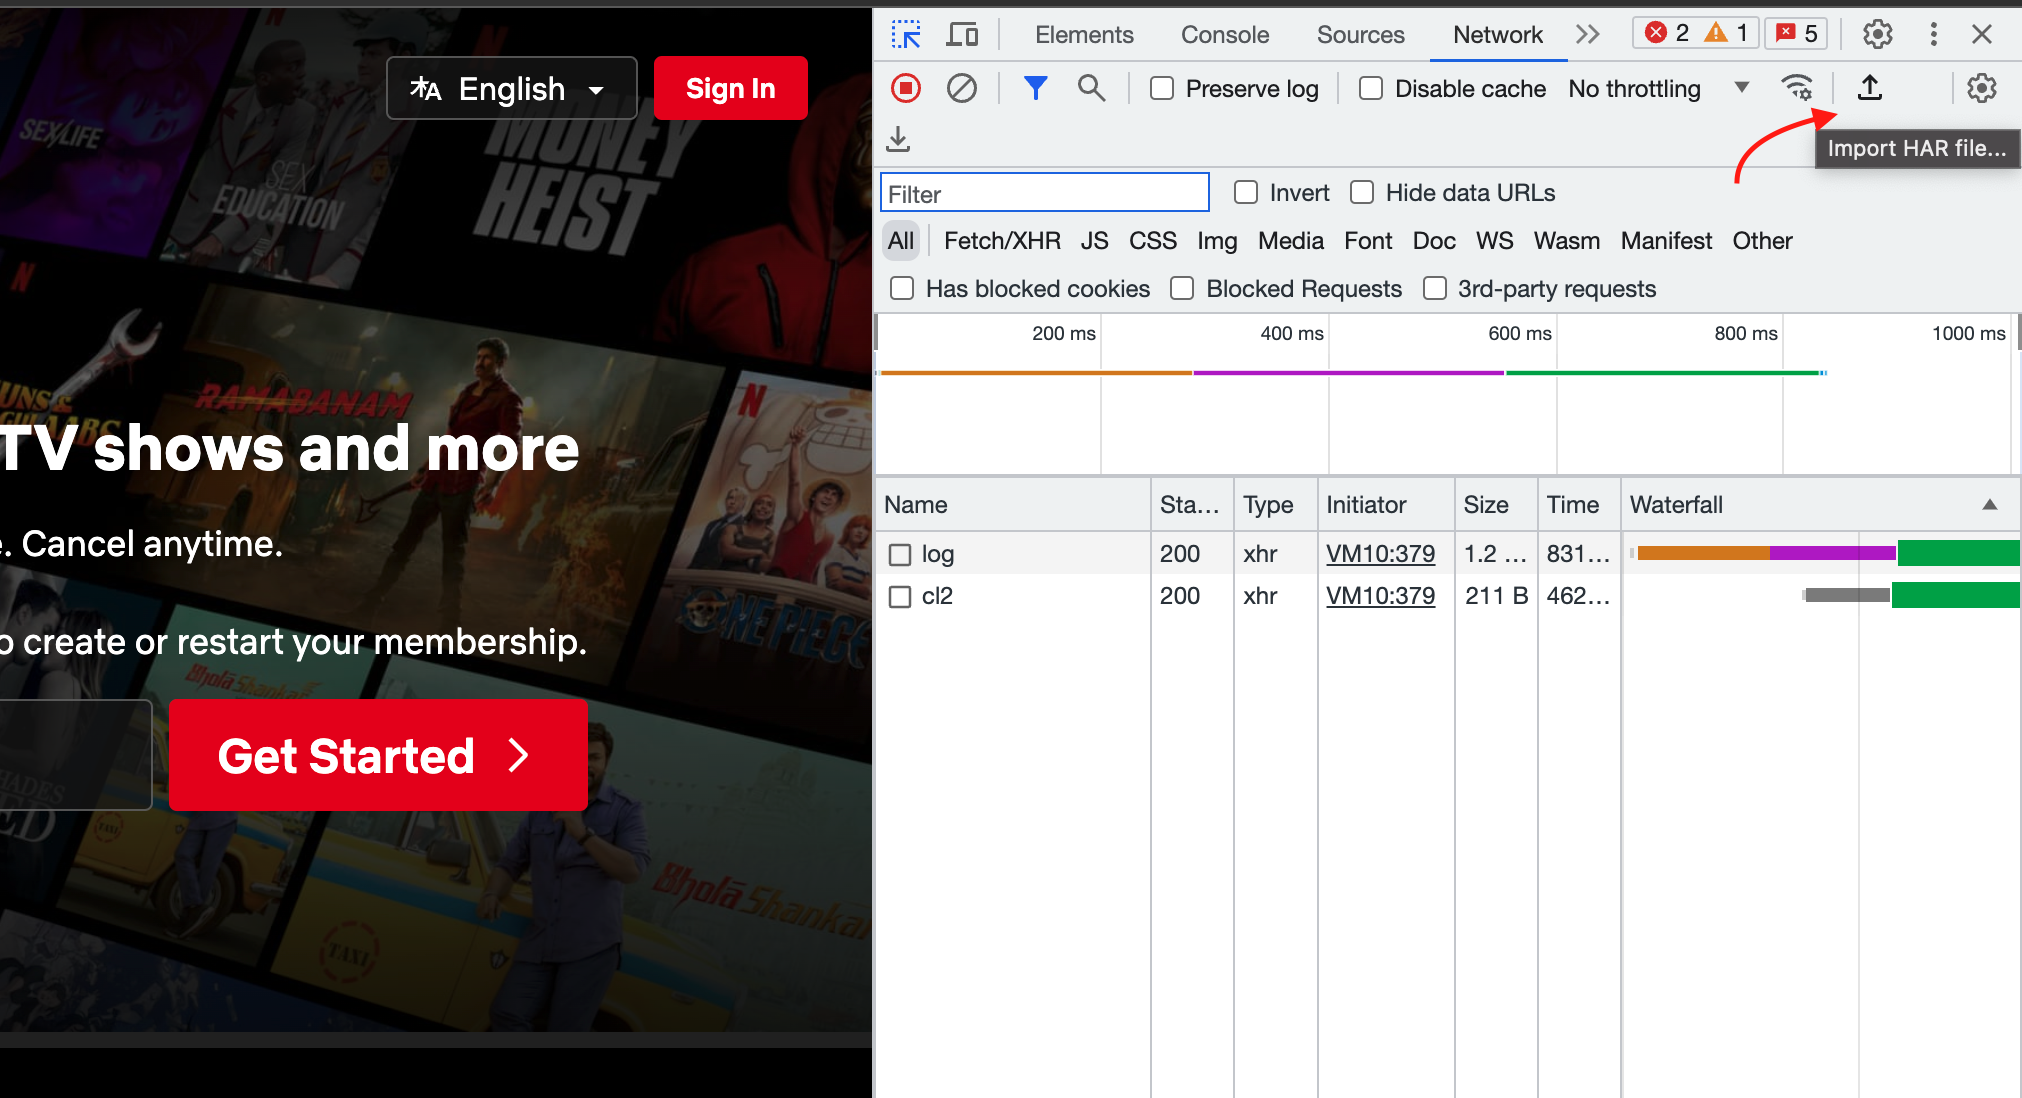
Export HAR files from Requestly and Import HAR files into Requestly
HAR, short for HTTP Archive, is a format for tracking information between web browsers and websites. A HAR file can identify performance issues, such as bottlenecks, slow load times, and page rendering problems.
We have covered how to generate HAR files in Chrome, Firefox and Safari in this blog. To import a HAR file to Requestly, follow the below steps:
- Download Requestly’s Desktop App from here.
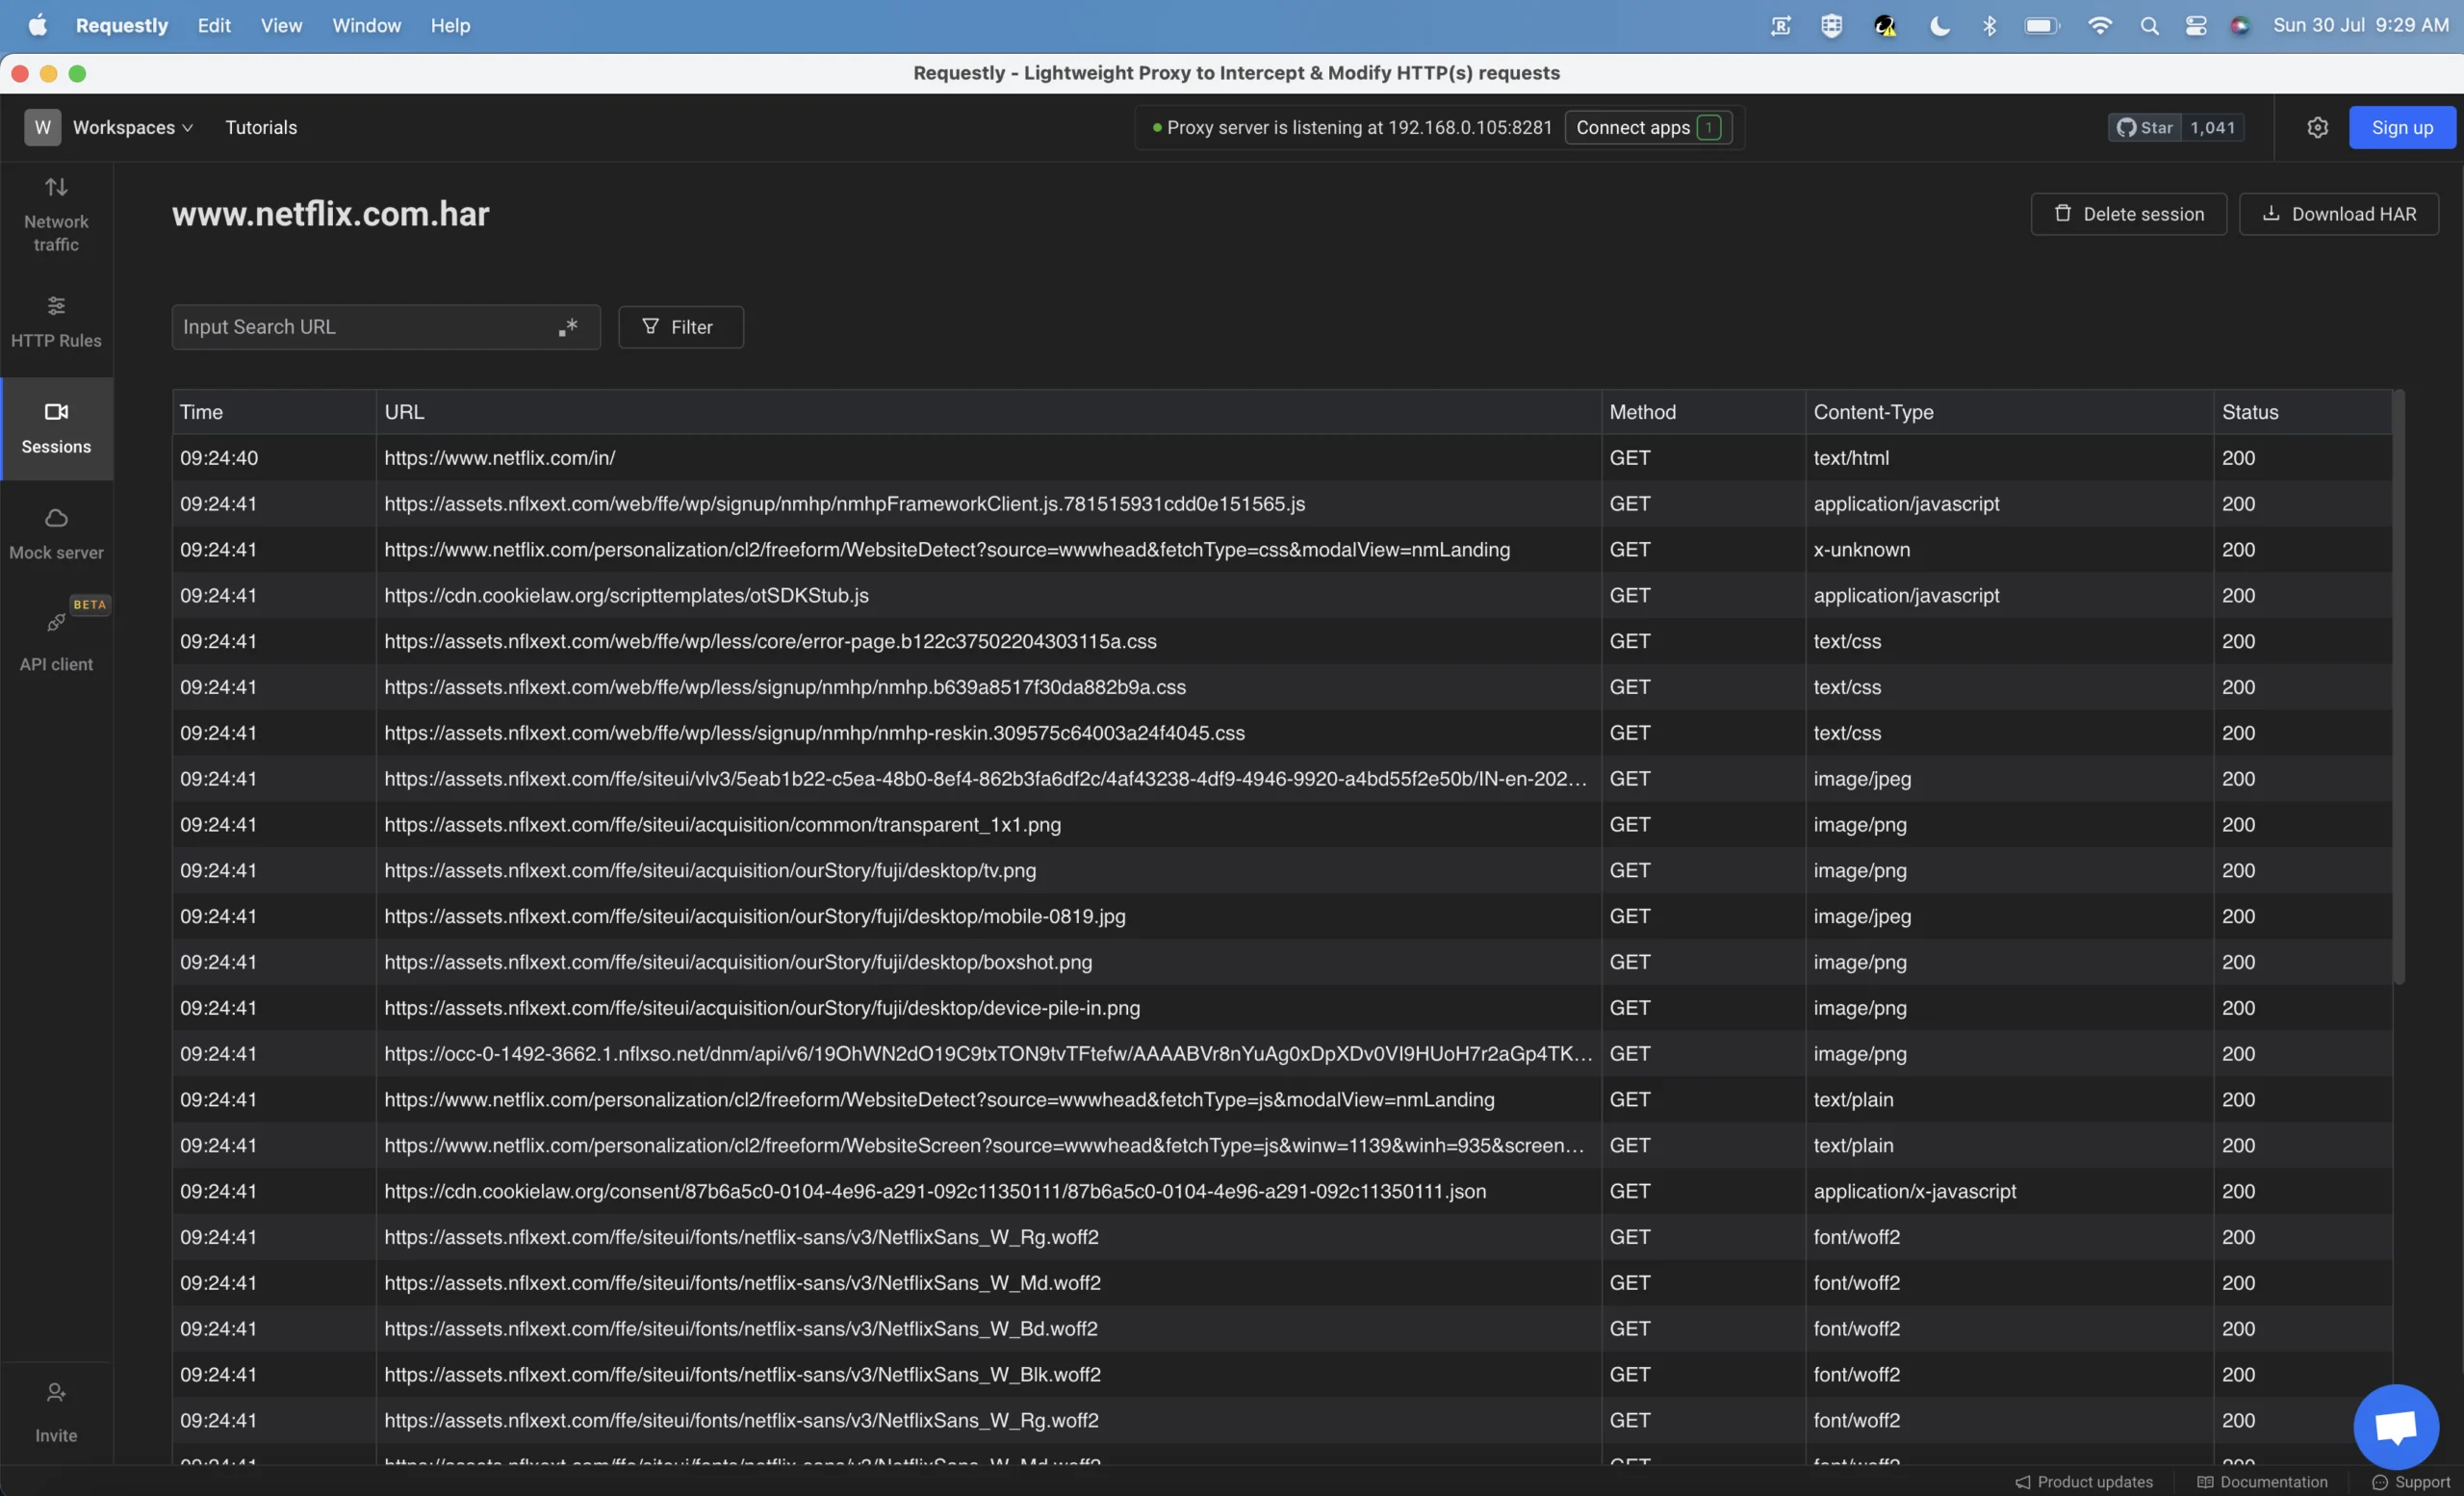
- Navigate to the sessions tab from the sidebar and click on “Import HAR” button.
- You will then be prompted to upload the HAR file you have. If you don’t have a HAR, you can generate a HAR file as described here.
- You can now view and analyze sessions in Requestly.
To show you a demonstration I’m using Netflix and will import HAR file of the website.
I have imported netflix.com HAR file and it looks like this.
Conclusion
Requestly allows to monitor network traffic from various devices be it browser, your whole system or mobile devices and also Requestly allows to modify network traffic i.e. Redirect API endpoints, Modify Headers, Modify API request & response body etc. Use Requestly for faster development & debugging.
Frequently Asked Questions
What does inspecting network traffic on Mac mean?
It means viewing the requests and responses exchanged between a device and servers to understand how apps and websites communicate.
Why should developers inspect network traffic?
To debug issues, verify data, understand APIs, check performance bottlenecks, and validate security.
Can network inspection help catch missing or incorrect data?
Yes. You can see raw request and response payloads and pinpoint incorrect parameters or backend issues.
Which tools can inspect network traffic on Mac?
Chrome DevTools, Safari Web Inspector, Firefox Developer Tools, Requestly Desktop App, Charles Proxy, Wireshark, tcpdump, and cURL.
How do I inspect network activity using Chrome DevTools on Mac?
Open DevTools with Command+Option+I, go to the Network tab, refresh the page, and click any request to view details.
Can I inspect system-wide network activity on Mac?
Yes. Tools like Requestly Desktop App, Charles Proxy, or Wireshark can capture traffic across apps.
What’s the fastest way to view all traffic from a browser and apps at once?
Enable system-wide capture in Requestly Desktop App.
Contents
- Introduction
- Debugging
- Performance Optimization
- Security
- Understanding APIs & Services
- Protocol Compliance
- Different Sources From Where You Can Inspect Traffic
- Monitor Network Traffic on Mac Using Terminal
- Inspect Network Traffic Using Chrome Dev Tools on Mac
- Inspecting Browser Network Traffic using Requestly Desktop App on Mac
- Inspecting Mobile Apps Network Traffic on Mac
- Export HAR files from Requestly and Import HAR files into Requestly
- Conclusion
- Frequently Asked Questions
- What does inspecting network traffic on Mac mean?
- Why should developers inspect network traffic?
- Can network inspection help catch missing or incorrect data?
- Which tools can inspect network traffic on Mac?
- How do I inspect network activity using Chrome DevTools on Mac?
- Can I inspect system-wide network activity on Mac?
- What’s the fastest way to view all traffic from a browser and apps at once?
Subscribe for latest updates
Share this article
Related posts
Get started today
Requestly works on desktop.
Enter your email below to get the download link and try it when you’re on your PC.


