
Home / Blog / API Client
API ClientAPI Load and Performance Testing: A Practical Guide
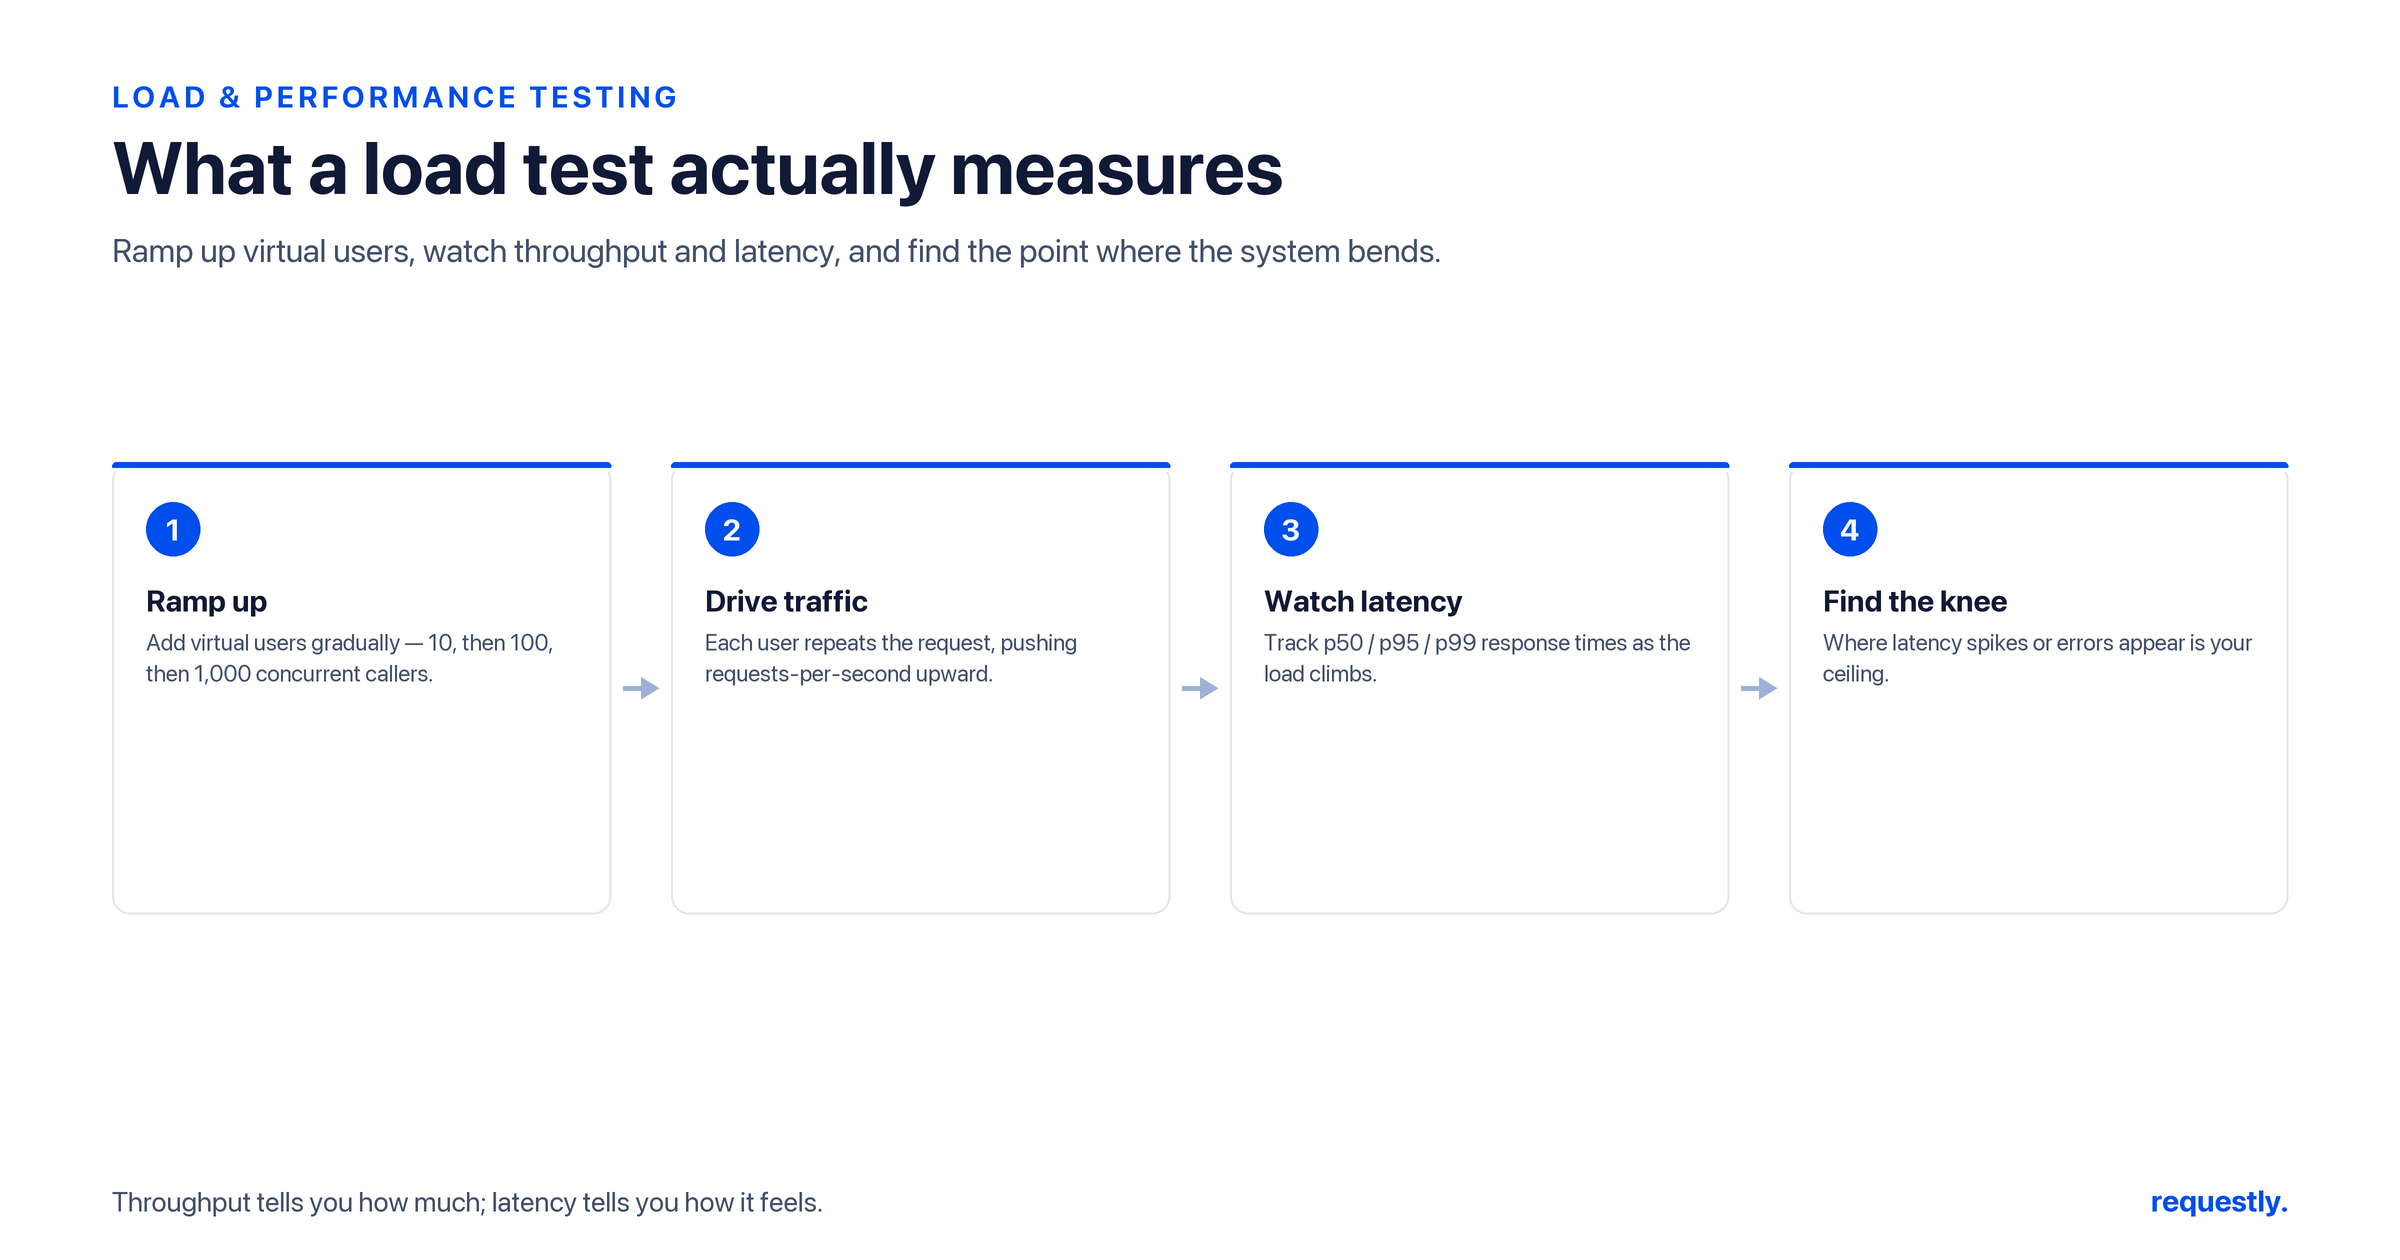
Functional tests tell you an API returns the right answer. They say nothing about what happens when a thousand users hit it at once. Load and performance testing fills that gap: it tells you how fast your API responds under real traffic, how many requests per second it can sustain, and exactly where it falls over. This practical guide explains the core concepts, the metrics that matter, and how to run your first load test with the four tools most teams reach for - k6, JMeter, Gatling, and Locust.
What load and performance testing actually means
Performance testing is an umbrella term for several related activities, each answering a different question. Mixing them up is the most common mistake teams make, so it helps to define them clearly:
- Load testing measures behavior at an expected or peak traffic level - for example, the concurrency you see on your busiest day. It answers: does the API stay healthy under normal pressure?
- Stress testing pushes past that limit to find the breaking point. It answers: where does the system fail, and does it fail gracefully or fall over hard?
- Spike testing throws a sudden, sharp burst of traffic at the API - the flash crowd from a product launch or a viral post - to see whether it can absorb the surge and recover.
- Soak (endurance) testing runs a moderate load for hours to surface slow problems such as memory leaks, connection-pool exhaustion, or a log disk filling up.
All four share the same mechanism: a tool simulates many virtual users (VUs) sending requests concurrently, then records how the API responds.
The metrics that matter
A load test is only as useful as the numbers you read from it. Watch these four:
- Latency percentiles. Report
p95andp99, not the average. An average of 120 ms can hide a p99 of two seconds - and it is that slow tail that real users feel. Set your thresholds against percentiles. - Throughput. Requests per second (RPS) the system actually sustains. This is your capacity ceiling.
- Error rate. The percentage of non-2xx responses, timeouts, and connection failures. A test that is fast but returns 503s under load has still failed.
- Concurrency. How many virtual users were active. Latency and errors only make sense in the context of the load that produced them.
Tie these to a service level objective (SLO) - for example, “p95 under 500 ms with under 1% errors at 100 concurrent users” - so a run produces a clear pass or fail rather than a wall of charts.
Four tools for API load testing
1. k6 - code-first and CI-friendly
k6 is a modern, developer-oriented load tester from Grafana Labs. Tests are plain JavaScript, the runner is a single binary, and it is built to slot into CI pipelines. A minimal script defines how many virtual users to run and for how long:
import http from 'k6/http';
import { check, sleep } from 'k6';

export const options = {
  vus: 50,            // 50 virtual users
  duration: '30s',    // run for 30 seconds
};

export default function () {
  const res = http.get('https://api.example.com/v1/products');
  check(res, {
    'status is 200': (r) => r.status === 200,
    'body is not empty': (r) => r.body.length > 0,
  });
  sleep(1);
}
Run it from the command line:
# install (macOS)
brew install k6

# run the script
k6 run load-test.js
The real power is in thresholds and stages. Thresholds turn a run into a pass or fail gate, and stages let you ramp load up and down to find where latency degrades:
export const options = {
  thresholds: {
    http_req_duration: ['p(95)<500'],  // 95% of requests under 500ms
    http_req_failed: ['rate<0.01'],     // less than 1% errors
  },
  stages: [
    { duration: '1m', target: 100 },   // ramp up to 100 VUs
    { duration: '3m', target: 100 },   // hold at 100 VUs
    { duration: '1m', target: 0 },     // ramp down
  ],
};
If any threshold is breached, k6 exits with a non-zero code - exactly what you want for a CI gate.
2. JMeter - the mature GUI veteran
Apache JMeter has been the industry workhorse for two decades. You build a test plan in a desktop GUI from thread groups (virtual users), samplers (requests), and listeners (result collectors), and a large plugin ecosystem covers everything from JDBC to Kafka. For repeatable runs and CI, you save the plan as a .jmx file and execute it headlessly, generating an HTML dashboard from the results:
# run a saved test plan headless and write results + an HTML report
jmeter -n -t product-load.jmx -l results.jtl -e -o ./html-report
JMeter is a great fit when you want a visual test builder, need protocol breadth beyond HTTP, or work on a team that already standardizes on it.
3. Gatling - expressive scenarios and rich reports
Gatling uses a code-based DSL (Scala or Java) to describe user journeys, and it produces detailed, good-looking HTML reports out of the box. Its asynchronous engine handles high concurrency on modest hardware. A simple simulation ramps 100 users over a minute:
import io.gatling.core.Predef._
import io.gatling.http.Predef._
import scala.concurrent.duration._

class ProductsSimulation extends Simulation {
  val httpProtocol = http.baseUrl("https://api.example.com")

  val scn = scenario("List products")
    .exec(http("GET products").get("/v1/products").check(status.is(200)))

  setUp(
    scn.inject(rampUsers(100).during(60.seconds))
  ).protocols(httpProtocol)
}
Gatling shines when you want scenarios that read like a story - log in, browse, add to cart, check out - with injection profiles that model realistic ramp-ups.
4. Locust - Python-native user behavior
Locust lets you describe virtual users as Python classes, with @task methods weighted to reflect real usage. It ships a live web UI and scales out across multiple worker processes. Here a user lists products three times as often as it creates an order:
from locust import HttpUser, task, between

class ApiUser(HttpUser):
    wait_time = between(1, 3)

    @task(3)
    def list_products(self):
        self.client.get('/v1/products')

    @task(1)
    def create_order(self):
        self.client.post('/v1/orders', json={'sku': 'ABC-123', 'qty': 2})
Run it headless for CI, controlling the user count and spawn rate:
# install
pip install locust

# headless run: 200 users, spawn 20/sec, target host, 5 minutes
locust -f locustfile.py --headless -u 200 -r 20 \
  --host https://api.example.com --run-time 5m
Locust is the natural pick for Python teams and for tests where modeling nuanced, weighted user behavior matters more than raw script brevity.
How to run your first load test well
- Get the functional request right first. Load testing a broken request just measures how fast you can return errors. Build and debug the request, its auth, and its body in an API client until it works, then put it under load.
- Test in a production-like environment. Numbers from your laptop against a local server are meaningless. Use a staging environment that mirrors production sizing, and run the load generator from separate infrastructure so the generator is not competing with the system under test.
- Model realistic traffic. Derive virtual-user counts from real analytics, mix endpoints in the proportions users actually call them, and include think time between requests.
- Ramp gradually and watch percentiles. Increase load in stages and find the point where p95 crosses your SLO. That inflection point is more valuable than a single big number.
- Make it a gate, not a one-off. Wire a smoke-sized load test into CI with pass/fail thresholds so a performance regression is caught the day it lands, not the day it pages you.
Where Requestly fits in
Requestly API Client is a Git-native desktop API client for REST, GraphQL, and SOAP. It gives you collections, environments and variables, pre- and post-response scripting, a Collection Runner with CSV/JSON data files, and assertion-based tests - all running on your machine. That makes it the ideal place to build and validate the requests you will later drive under load: get the endpoint, headers, auth, and body correct, confirm the functional contract, then hand a known-good request to your load tool.
Dedicated load and performance testing is on our roadmap and is not a shipped feature yet. Until it lands, the practical path is to design and debug requests in Requestly, then run the load itself with k6, JMeter, Gatling, or Locust using the tool that matches your stack.
If you are mapping out a broader testing strategy, see our companion guides on setting up API monitoring, testing WebSocket APIs, and testing gRPC services. For a wider tool landscape, our roundup of the best API testing tools is a good starting point.
Try Requestly API Client: A Git-native desktop API client for REST, GraphQL, and SOAP - with collections, environments, scripting, a Collection Runner, and assertion-based tests that run fully on your machine. Download Requestly →
Frequently asked questions
What is API load testing?
API load testing measures how an API behaves under concurrent traffic. Instead of sending one request and checking the response, you simulate many virtual users hitting endpoints at once and record throughput, latency percentiles, and error rates. The goal is to learn how the system performs at expected load, where it starts to degrade, and at what point it breaks.
What is the difference between load, stress, and spike testing?
Load testing checks behavior at an expected or peak traffic level. Stress testing pushes beyond that limit to find the breaking point and observe how the system fails and recovers. Spike testing throws a sudden, sharp burst of traffic at the API to see whether it can absorb a flash crowd. Soak testing runs a moderate load for hours to surface memory leaks and slow resource exhaustion.
Which tool should I use for API load testing?
k6 is a strong default for developers because tests are written in JavaScript and run from the command line, which fits CI well. JMeter offers a mature GUI and a huge plugin ecosystem. Gatling provides expressive Scala or Java DSL scripts and detailed HTML reports. Locust lets you describe user behavior in Python. The best choice depends on your language preference and whether you want a GUI or code-first workflow.
What metrics matter most in a load test?
Focus on latency percentiles (p95 and p99 rather than averages), throughput measured in requests per second, the error rate, and concurrency in terms of active virtual users. Averages hide the slow tail of requests that real users notice, so percentile thresholds are the metrics you should assert against in a pass or fail check.
How many virtual users should I simulate?
Base it on real numbers rather than a round figure. Estimate peak concurrent users from production analytics, add headroom for growth and marketing spikes, and ramp up gradually so you can see where latency climbs. Start small, find the point where percentiles cross your service level objective, then test beyond it to understand your safety margin.
Does Requestly support load and performance testing?
Requestly is a local-first API client for REST, GraphQL, and SOAP, with collections, environments, scripting, a Collection Runner, and tests. Dedicated load and performance testing is on our roadmap and not yet shipped. For now we recommend k6, JMeter, Gatling, or Locust for load work, and Requestly for building, debugging, and functionally testing the requests you will later put under load.
Test any API request visually: import a cURL command or build from scratch in Requestly, the API client for developers.
Download →