







Requestly
FeaturesHTTP InterceptorPricingRequestly vs PostmanBlogDocsDownload

Home / API Client / DevTools

Browser DevTools, for the requests you fire from Requestly

Console output from your scripts, every request the runtime sent, and the value each {{variable}} actually resolved to — in one panel, docked to the bottom of the app.

  • Console. Everything your scripts logged, filterable by level and source.
  • Network. Every request including ones fired by rq.sendRequest and the collection runner.
  • Show resolved values. Swap {{variable}} placeholders for the exact bytes that went over the wire.
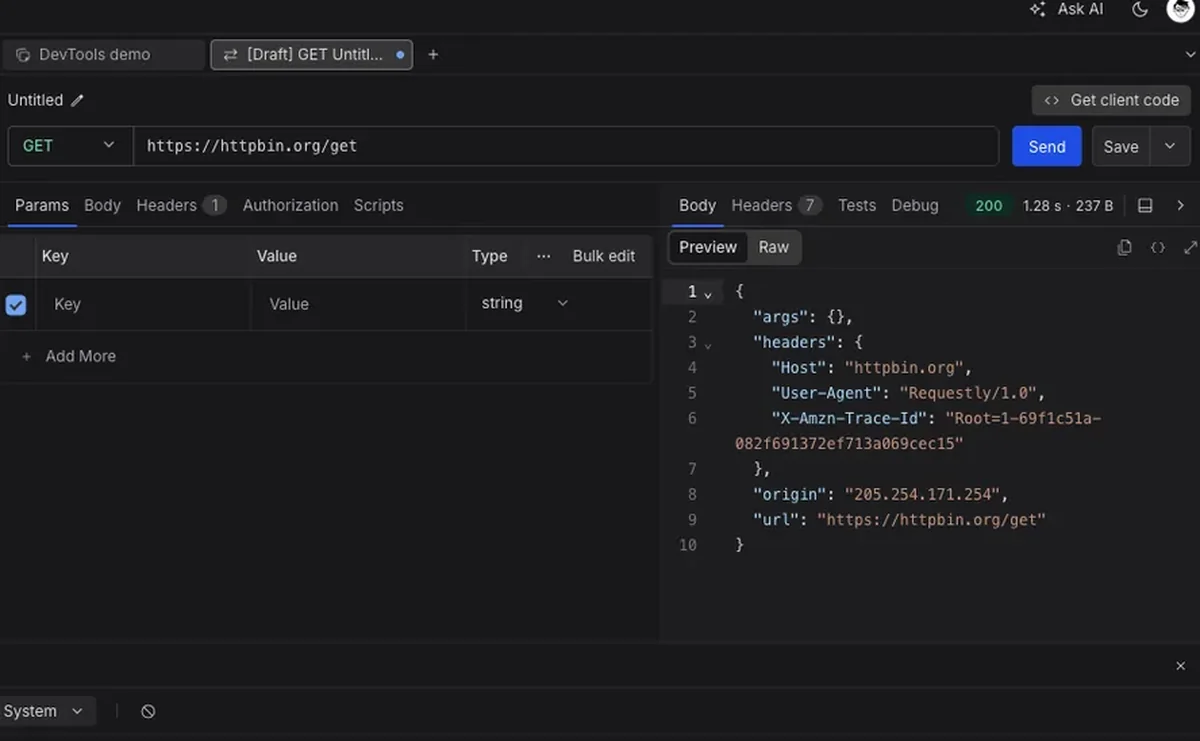
The DevTools panel in the Requestly API Client showing console and network activity

Used by 300,000+ developers at 50,000+ companies

The gap between “it failed” and “here’s why”

Most API debugging is a guessing game about what actually got sent. DevTools closes that gap: it captures your script output, every request the runtime made, and what each variable resolved to at send time.

Open DevTools

Click DevTools in the app footer and the panel docks to the bottom of the workspace, showing everything from the current session. Or open a request and use the Debug tab next to Body and Headers — same tool, scoped to that one request’s latest run.

Turn on resolved values

Headers and Payload carry a Show resolved values switch. Off, you see your request as authored.

Read the documentation →

Three tabs, one debugging loop

Open it session-wide from the footer, or scoped to a single request from its Debug tab.

Console

Everything your pre and post-response scripts logged, plus system events. Filter by level, by source, or search for a value you logged.

Network

Every request the runtime sent — including ones fired by rq.sendRequest and by the collection runner — with method, status, timing and size.

Resolved values

A toggle that swaps your {{variable}} placeholders for the exact values that went over the wire.

Per-request Debug tab

Scope DevTools to one request's most recent run instead of scrolling past unrelated activity.

Filters that combine

Search, status class and HTTP method stack with AND, so you can isolate just the 5xx POSTs to one endpoint.

Variables panel

Every variable the request referenced, the scope it resolved from, and the value it got.

Why developers switched

★★★★★ verified user

Requestly is the first API client that has genuinely replaced Postman for me. Everything runs locally, so my API data never goes through a cloud server. No bloat, no pressure to upgrade.

Hasan Toor
Hasan Toor
AI & Tech Educator
★★★★★ verified user

Postman stopped fitting the way our team works. We wanted our API collections in Git, not locked inside another tool. Requestly stores everything as plain JSON files, giving us full control over versioning and reviews.

NIJ Ruvos
NIJ Ruvos
Engineering Lead
★★★★★ verified user

We migrated from Postman to Requestly's API Client and it has been a great experience. Storing collections locally, keeping them in Git, and working with simple JSON files made the transition seamless.

Harry S
Harry S
Principal Engineer at Tapistro

Related features

More of what the Requestly API Client does.

AI Test Case Generator

Write tests from a plain-English prompt

API Tests & Assertions

Assert on status, body and schema

Requestly CLI

Run collections in CI

Collection Runner

Run a whole collection in order

Data-Driven Testing

Drive collection runs from a CSV or JSON file

Generate Client Code

Export requests to 20+ languages

See all features →

Frequently Asked Questions

Two ways. Click DevTools in the application footer for a session-wide view of everything that has happened, or open a request and use the Debug tab next to Body, Headers and Test Results to scope it to that one request's latest run.

Yes — this is the fastest way to debug a failing request. Headers and Payload have a Show resolved values toggle. Off, you see the request as you wrote it with {{variable}} placeholders. On, you see the exact bytes sent after substitution.

Yes. The Network tab lists every request the runtime sent on your behalf, including calls made with rq.sendRequest inside a script and every request issued by the collection runner.

Script logs are tagged, so typing #script into the Console search box hides system and network entries and leaves only what your own scripts logged.

Up to 25,000 console lines, 10,000 network requests, and 5,000 system events. Once a category fills, the oldest entries drop off. Activity clears when you reload the app, so copy anything you want to keep.

Cookie capture depends on the cookie jar, which is a desktop-app feature. If it is not enabled for your build, the Cookies panel and the per-request Cookies tab do not appear.

Stop guessing why a request failed

Open DevTools, flip on resolved values, and see the exact bytes that went over the wire. Available on macOS, Windows and Linux.

macOS, Windows & Linux